Buying website traffic is one of the fastest ways to put real people in front of a new page, offer or market. Instead of waiting months for search rankings, you can see within days how visitors from a chosen country, city or device respond to your headline, your price and your call to action. That speed makes paid visits a practical tool for testing, launching and learning.
Businesses trust this model at scale. Research estimates cited by Wikipedia's article on online advertising put US online ad spend at $125.2 billion in 2019, about $54.8 billion more than the spend on television. The choice of route also gives you a wide range of options: in the US in 2026, a typical search ad click costs about $5.42, while a pop-under visit costs about a third of a cent.
That range is good news, because it means a route exists for almost every goal and budget. This guide helps you pick the right one with price tables, test-size math, a 14-day test plan and the checks we use to confirm visit quality in Google Analytics 4.
What You Actually Pay For When You Buy Website Traffic
The first problem every buyer meets is that sellers price different things. A search network charges per click, a display network often charges per 1,000 impressions, a traffic service may charge per visit, and a managed platform may sell credits. Each unit is honest on its own terms, but the units do not compare directly.
Here is a typical case. One offer promises 50,000 hits for $50, and a native campaign offers clicks at $0.25 each, so the same $50 buys 200 clicks. The first offer looks 250 times better until you learn that a hit is any file request to the server, and one page view can create dozens of hits. The two offers measure different events, and neither number tells you how many people arrived.
The older way to judge traffic was a hit counter on the page or the seller's own report. The current standard is a session that your own analytics records under a campaign tag, because that is the only number you control. The table explains the five pricing models you will meet.
| Pricing model | What you pay for | How it turns into visits | Main risk |
|---|---|---|---|
| Cost per click (CPC) | A click on your ad | Most clicks become visits, but some people close the tab before the page loads | Paying for accidental or invalid clicks |
| Cost per mille (CPM) | 1,000 ad impressions | Only people who click become visits, except pop-under ads, where each impression opens your page | Impressions that nobody saw |
| Cost per visit (CPV) | One page opening | One paid unit per arrival | Each seller defines a "visit" in its own way |
| Prepaid credits | A balance that each visit uses up | The platform states how many credits one visit uses | Money locked in if unused credits are not refundable |
| Flat fee | A placement for a fixed period | Depends on the publisher's audience | No guarantee of any clicks |
Pay-per-click is the model where the advertiser pays each time someone clicks the ad. Cost per mille is the price of 1,000 ad impressions, where an impression is one display of the ad on a screen.
The fix: one unit for every offer
The practical fix is to convert every offer into one number: cost per 1,000 verified sessions. You take the money spent on a campaign, divide it by the sessions Google Analytics 4 (GA4) records for that campaign's tag, and multiply the result by 1,000. A verified session is a visit that your own analytics recorded, not a visit that the seller reported.
This works for two reasons. First, it applies one counting rule to every seller, so the differences between hits, clicks, impressions and credits disappear. Second, it includes the loss between a paid click and a loaded page, which is a real cost that most price lists ignore.
Where to Buy Website Traffic: Six Routes and Who Each One Suits
Many first-time buyers choose a route by price or by the first search result, and only later learn that the route needs skills or a budget they do not have. A founder with $300 opens a Google Ads account, bids on broad terms and spends the budget on about 50 clicks in two days. Another buyer joins a self-serve pop network and faces a minimum deposit, a live bid auction and hundreds of source IDs to filter. Neither route was wrong; each one simply suited a different buyer.
The good news is that every common goal has a route that fits it. The six routes below differ in where the visitor comes from, what the visitor has in mind and how much work you put in each day.
| Route | Where the visitor comes from | Visitor mindset | Your setup work | Best for |
|---|---|---|---|---|
| Search ads | A search results page | Looking for an answer or product right now | Keywords, bids, ad copy and daily checks | Sales and leads where demand already exists |
| Social ads | A feed on Meta, TikTok, LinkedIn or Reddit | Scrolling and open to discovery | Creatives, audiences and frequent refreshes | Visual products and audience building |
| Native and display networks | Articles and banners on publisher sites | Reading content | Headlines, images and placement lists | Content promotion and brand awareness |
| Self-serve push and pop networks | Push notifications and pop-under windows | Interrupted, with short attention | Bids, source lists and fraud filters | High-volume tests of broad offers |
| Managed traffic platforms | Display, native and pop-under placements that the platform buys | Browsing a publisher site | Page URL, targeting and budget | Landing page tests, geo tests and first audience data |
| Direct publisher deals | A newsletter, podcast or niche website | Trusts the publisher | Outreach and negotiation | Niche B2B offers and communities |
Search ads deliver the strongest intent because the visitor asked a question first. Social ads reach people who did not search but match an audience profile. Native advertising, which Wikipedia describes as paid content that matches the form and function of the platform where it appears, suits articles and guides, while classic banners face banner blindness, the habit of ignoring anything that looks like an ad.
Self-serve push and pop networks offer the lowest prices and the most volume. In exchange, they expect you to manage bids, block weak sources and write creatives that work in a few seconds of attention.
The managed route grew out of that workload gap. A managed platform buys the placements itself and sends you the people who choose to open your page. SparkTraffic, a paid website traffic platform that has served more than 27,000 paying customers since 2015, is an example of this route: its visitors see an ad in a display, native or pop-under placement on a partner publisher site and choose to open the advertiser's page. You set the country, region or city and the device, the team reviews each landing page before launch, and every campaign link can carry a UTM tag, so the visits appear as their own row in your analytics.
This route works well for landing page tests, local launches and new sites that need their first audience data, because it removes the bid and source management without hiding where visitors come from. The SparkTraffic page on how to buy website traffic shows the details a transparent offer should disclose: the placements that deliver visitors, the targeting options, the credit cost of one visit and the refund terms for unused credits.
Direct publisher deals sit at the other end. You pay a newsletter or niche site a flat fee, and you get an audience that already trusts that publisher. The price is negotiated, so the useful question to ask is how many clicks similar sponsors received.
The practical way to choose is to match the route to your goal and to the hours you can spend each week. If your goal is sales from existing demand, search ads come first. If your goal is to test a page, a city or a message with a small budget and little setup time, a managed platform or a native network gives you data fastest. This order works because each route is strongest where its visitor's mindset matches your page.
Website Traffic Prices in 2026: A Route-by-Route Comparison
Price information about traffic is scattered and often undated. Benchmark studies quote averages for one platform, ad networks publish minimum bids instead of typical prices, and many lists copy numbers from older articles. A buyer who compares a $5 cost per click with a $5 cost per 1,000 impressions makes a 1,000-fold mistake without noticing.
Averages also hide the expensive end. In the US, advertisers bid about $18 per click on the phrase "buy website traffic" itself, more than three times the all-industry search average.
The table converts typical 2026 US prices into cost per 1,000 visits and shows what a $100 budget buys on each route. The ranges come from public benchmark studies and ad network rate cards. They are planning ranges, not quotes, and your price depends on industry, targeting, season and creative.
| Route | How you pay | Typical US price, 2026 | Cost per 1,000 visits | What $100 buys |
|---|---|---|---|---|
| Search ads (Google, Microsoft Bing) | CPC auction | $1.63 to $9.87 per click by industry, about $5.42 on average | $1,630 to $9,870 | About 18 visits (10 to 61) |
| Social ads (Meta traffic campaigns) | CPC or CPM auction | $0.34 to $0.86 per click by industry, about $0.60 on average | $340 to $860 | About 167 visits (116 to 294) |
| Display networks | CPM or CPC | About $0.30 to $1.00 per click | $300 to $1,000 | About 159 visits (100 to 333) |
| Native ad networks | CPC | About $0.10 to $0.60 per click | $100 to $600 | About 333 visits (167 to 1,000) |
| Push notification ads | CPC | About $0.01 to $0.10 per click | $10 to $100 | About 2,500 visits (1,000 to 10,000) |
| Pop-under ads | CPM, each impression opens your page | About $1 to $6 per 1,000 | $1 to $6 | About 28,600 visits (16,700 to 100,000) |
| Managed platforms with prepaid credits | Prepaid credits | Set per platform, see the next section | Credits per visit × price per 1,000 credits | Depends on your targeting |
| Direct publisher deals | Flat fee or negotiated CPM | Negotiated | Ask for past click numbers | Varies by audience |


Why the cheapest visit is rarely the cheapest result
The charts show a gap of more than three orders of magnitude between search and pop-under traffic. That gap reflects attention as well as supply. A search visitor typed a question and chose your answer, while a pop-under visitor met your page in a window that opened behind the one they were reading, as Wikipedia's article on pop-up ads explains.
The practical rule is to compare routes on cost per key event, not cost per visit. A key event is an action you mark as important in GA4, such as a sign-up, a demo request or a click on the pricing page.
If 1,000 pop-under visits cost $3.50 and produce two sign-ups, and 1,000 native visits cost $300 and produce 15, the pop-under route is still cheaper per sign-up ($1.75 against $20). The opposite can be true for another page, which is why your test, not the price list, makes the final call. SparkTraffic's comparison of pop-under, native and push traffic explains how each format behaves on the page.
How to compare prepaid credits with click prices
Managed platforms often sell prepaid credits instead of clicks, and a credit price only becomes comparable once you turn it into visits. On SparkTraffic, plans start at $9.96 per month for 60,000 credits, and the price per 1,000 credits falls from $0.16 on the smallest monthly plan to $0.07 on the largest. One visit uses one or more credits depending on your targeting, and the campaign page shows the number before you start.
The conversion is one line of math: credits per visit multiplied by the price per 1,000 credits gives you the cost per 1,000 visits. You can then place that figure next to the rows in the table above. Two terms matter as much as the price. Free test credits let you run this calculation on a real campaign before you pay, and a refund policy for unused credits removes the main risk of prepaying.
How Much Website Traffic Is Worth to Your Business
Many buyers ask what website traffic is worth and receive answers based on industry averages. The honest answer is that a visit has no fixed value. Its value equals the chance that the visitor converts multiplied by the profit that one conversion brings, so the same visit is worth very different amounts to different businesses.
Consider two businesses that buy the same 1,000 native visits for $300. Store A sells $40 candles with a 30% margin, so each order brings $12 of profit, and at a 1% conversion rate the visits produce $120. Store B sells a $400 annual software plan that brings $300 of profit, and at a 0.5% conversion rate the visits produce $1,500. Store A loses $180, Store B earns five times its spend, and the traffic was identical.
The formula gives you a ceiling before you spend anything:
- Value of 1,000 visits = 1,000 × conversion rate × profit per conversion
- Break-even conversion rate = cost per 1,000 visits ÷ (1,000 × profit per conversion)

A route pays off where your solid line sits above that route's dashed line. The table shows the break-even conversion rate for two common profit levels at typical 2026 US prices.
| Route | Typical cost per 1,000 visits | Break-even conversion rate at $30 profit per conversion | Break-even conversion rate at $100 profit per conversion |
|---|---|---|---|
| Search ads | $5,420 | 18.1% | 5.4% |
| Social ads | $600 | 2.0% | 0.6% |
| Display networks | $630 | 2.1% | 0.63% |
| Native ad networks | $300 | 1.0% | 0.3% |
| Push notification ads | $40 | 0.13% | 0.04% |
| Pop-under ads | $3.50 | 0.012% | 0.0035% |
The table explains a pattern you see in every market. Search ads pay off for high-value sales and leads, because only a high profit per conversion can carry a $5 click. Low-cost formats need only a tiny conversion rate to break even, but their visitors also convert less often, so the test must show which effect is stronger for your page.
Two details keep the math honest. Profit per conversion means margin after product and delivery costs, not revenue, because revenue overstates what you can afford to spend. For businesses that sell through leads, the value of a lead equals the share of leads that become customers multiplied by the profit per customer. SparkTraffic's free break-even ROAS calculator runs the same check for return on ad spend.
How Many Visits a Fair Traffic Test Needs
Most failed traffic tests fail on size, not on quality. A buyer sends 200 visits to a page, sees four sign-ups and calls the source a 2% converter. One more sign-up would raise the measured rate to 2.5%, and one fewer would cut it to 1.5%, so a single person moves the result by 25%. Decisions made on numbers this small drop good sources and scale weak ones.
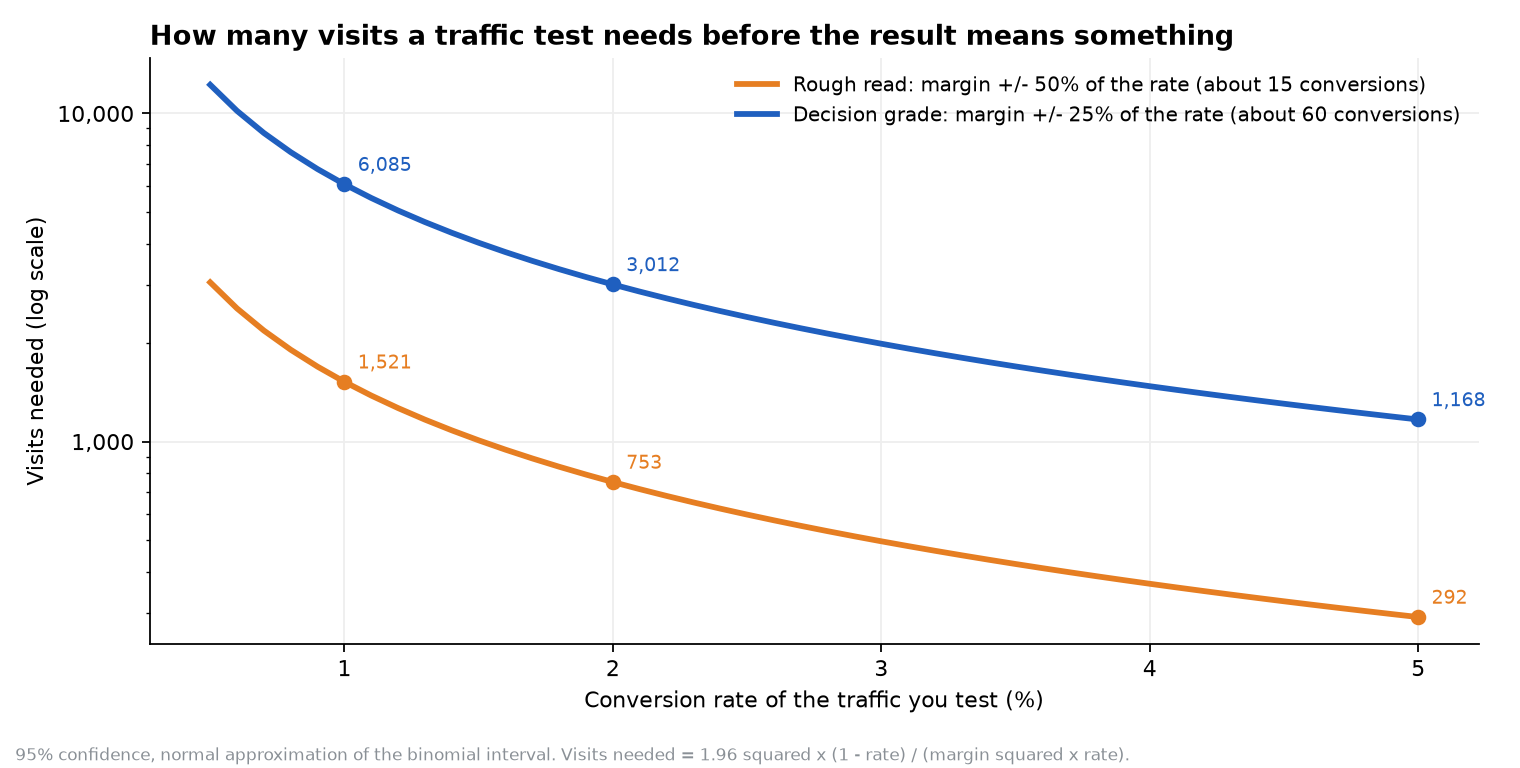
The statistics behind this are simple. A conversion rate measured on a sample has a margin of error, and Wikipedia's article on the binomial proportion confidence interval gives the standard formula. Turned around, the formula tells you how many visits a test needs, a step known as sample size determination.
The useful insight is that the test size depends on conversions, not on visits. At 95% confidence, you need about 15 conversions for a rough read, where the true rate sits within ±50% of what you measured. You need about 60 conversions for a decision-grade read within ±25%. A low conversion rate therefore needs many more visits to reach the same number of conversions.
| Expected conversion rate | Visits for a rough read (±50%) | Visits for a decision (±25%) | Conversions at the decision point |
|---|---|---|---|
| 0.5% | 3,058 | 12,232 | About 61 |
| 1% | 1,521 | 6,085 | About 61 |
| 2% | 753 | 3,012 | About 60 |
| 3% | 497 | 1,987 | About 60 |
| 5% | 292 | 1,168 | About 58 |
How to make a test affordable
Size multiplied by price gives the budget. At typical 2026 US prices, 1,500 visits, a rough read for a page that converts at 1%, cost about $8,130 on search, $900 on social, $450 on native, $60 on push and $5.25 on pop-under. Low-cost formats usually convert at lower rates, so they need more visits than this example, but they still let a small budget reach a readable sample.
The second lever is a micro-conversion, which is a smaller action that signals interest, such as a click on the pricing page or a scroll to the end of a guide. Micro-conversions happen far more often than purchases. At a 10% micro-conversion rate, a decision-grade read needs only about 553 visits. This works because the micro-conversion tells you whether the source sends interested people, and you can keep the purchase test for the sources that pass.
A 14-Day Test Plan for Your First Traffic Purchase
A typical first test goes wrong in a predictable way. The buyer launches on a Friday, changes the headline on Saturday and the targeting on Sunday, and stops the campaign on Monday because the numbers look flat. Three changes in three days, plus a weekend audience, make the result impossible to read.
Weekly cycles matter more than most buyers expect. People browse, compare and buy differently on weekdays and weekends, so a test shorter than one full week measures the calendar as much as the traffic. Two full weeks give you one clean baseline week and one week to test a single change.
| Day | What you do | Why it matters |
|---|---|---|
| Day 0 | You write down one goal and one decision rule, mark one key event in GA4 and build a separate UTM link for each route, country and device | A rule written before launch stops you from reading the result to fit your hopes, and one tag per segment gives each segment its own row |
| Day 0 | You open the landing page on a mid-range phone over mobile data | Many ad visitors arrive on mobile, and a slow page loses paid visitors before GA4 records them |
| Days 1 to 2 | You launch with a daily cap that spreads the budget over 14 days and confirm that the campaign row appears in GA4 the same day | A cap stops one day's audience from taking the whole budget, and an early tracking check protects the rest of it |
| Days 3 to 7 | You change nothing and record daily spend, verified sessions, engagement rate and key events | A stable first week gives a clean baseline |
| Day 8 | You review results by source or placement, pause the weakest ones if the platform allows it, and make one change | Averages hide weak sources, and one change keeps cause and effect clear |
| Days 9 to 13 | You run the changed version with the same daily cap | Equal conditions make the two weeks comparable |
| Day 14 | You apply the decision rule: scale, change or stop | The rule, not the mood of the day, makes the call |
UTM parameters are the five URL tags that analytics tools use to attribute a visit to a campaign, as Wikipedia's article on UTM parameters explains. SparkTraffic's free UTM builder creates the tags in under a minute, and the same method of one change at a time is the core of any A/B test.
How to Check Bought Visits in Google Analytics 4
The provider's dashboard and your analytics will never match exactly, and that gap confuses many buyers. A dashboard shows 1,000 delivered visits, GA4 shows 820 sessions, and the buyer either accuses the provider or stops checking. Both reactions waste the most useful data source you have.
Most of the gap has normal causes. Some visitors decline the consent banner, some use ad blocking tools that also block analytics, and some close the tab before the page loads. GA4 also excludes traffic from known bots automatically and groups activity into sessions with a 30-minute rule. The question is not whether the numbers differ, but whether the pattern looks like people.
Real people behave unevenly. They browse in daytime, use hundreds of device and browser combinations, and stay for very different lengths of time. Scripted traffic tends to be regular, because software repeats itself. The checks below turn that difference into a routine you can run in about 15 minutes per campaign.
| Check | Where in GA4 | Pattern you expect from real people | Warning pattern |
|---|---|---|---|
| Sessions against delivered visits | Reports, Acquisition, Traffic acquisition, filtered by session source / medium | GA4 a little lower than the provider's count, with a stable gap from day to day | GA4 above the delivered count, or a gap that swings sharply between days |
| Hour of day | Explorations, Hour dimension, filtered by your campaign | A curve that follows waking hours in the target time zone | A flat line across 24 hours, or spikes at exact hours |
| Engagement over time | Engagement rate and average engagement time by day | Values that move from day to day and differ between landing pages | Nearly identical values every day |
| Devices and browsers | Tech details, filtered by your campaign | A wide mix that matches your device targeting | One browser version or one screen size dominates |
| Locations | Demographic details, City, filtered by your campaign | Many cities inside the area you targeted | Countries you did not target, or clusters in data center hubs such as Ashburn, Virginia |
| Scrolls and clicks | Events report, scroll and click events by session source / medium | Some visitors scroll and click, many do not | Zero scroll events across hundreds of sessions, or 100% of sessions scrolling |
| Key events | Key events by session source / medium | Some micro-conversions once the test reaches its planned size | No key events at all after a test that reached its planned size |
GA4 counts a session as engaged when it lasts longer than 10 seconds, includes a key event or has at least two page views. A low engagement rate on its own does not prove poor quality, because interruptive formats such as pop-unders always show more quick exits than search. The warning signs are regularity and mismatch with your targeting, not low numbers.
Every check follows the human-first principle: you want proof that people, not scripts, read your page. A campaign that passes gives you audience data you can trust, and a campaign that fails gives you numbers that would mislead every later decision.
Red Flags: How to Recognize Low-Quality and Invalid Traffic
Invalid traffic is an old problem with a large price tag. Wikipedia's article on Internet bots cites a Comscore study that found over half of the ads shown across thousands of campaigns between May 2012 and February 2013 were not served to human users. In 2006, Google agreed to a $90 million settlement in a class action over click fraud, and the same Wikipedia article describes Methbot, a scheme that took at least $7 million from American companies for ad views that no person ever saw.
The sellers behind invalid traffic use familiar tools. Traffic bots are scripts that load pages and imitate visits, and traffic exchanges are networks where members view each other's pages to earn credits rather than out of interest. A typical offer promises 100,000 visitors with a guaranteed three-minute visit time and a 0% bounce rate. That promise is the warning, because no seller can guarantee what real people choose to do.
The table lists the red flags we see most often, why each one matters and what a trustworthy offer looks like instead.
| Red flag | Why it matters | What a trustworthy offer shows |
|---|---|---|
| No clear answer to "where do the visits come from?" | Without a source type, you cannot judge intent or check quality | Named ad formats and placements |
| Guaranteed time on site, bounce rate or pages per visit | Real people decide how long they stay, so a guarantee means the behavior is scripted | Engagement that you measure in your own analytics |
| Promises of higher Google rankings or AdSense income | Paid visits do not raise rankings, and AdSense holds the site owner responsible for invalid traffic | A clear statement of what the traffic can and cannot do |
| One flat price for every country | Real ad inventory costs more in some markets than in others | A price that changes with targeting |
| No landing page review, and link shorteners accepted | Real publishers and ad networks screen the pages they promote | A review step before the campaign starts |
| No UTM support and no reporting by source | You cannot verify what you cannot separate | Campaign tags and per-source or per-placement reports |
| Prepaid packages with no refund for unused balance | Your money is locked in before you have any data | Refunds for unused budget or pay-as-you-go billing |
| Visits arrive at the same rate at 3 a.m. as at 3 p.m. local time | Human browsing follows the daily cycle of the target country | Delivery that follows local daytime |
Each flag points to the same root cause: no real ad auction or publisher audience stands behind the visits. Shortcuts like these do not save money. They fill your analytics with numbers that hide what real visitors do, and they can put an AdSense account or an ad account at risk.
When Buying Website Traffic Is the Wrong Move
Some buyers expect paid visits to solve problems they cannot solve. A blogger buys traffic to climb in Google, a publisher buys it to raise AdSense income, and a store owner buys it to rescue a product page that nobody converts on. In each case the money goes to the wrong lever, and the disappointment gets blamed on the traffic.
The first case is search rankings. Ad visits arrive through ad placements, not through Google's search results, so Search Console does not count them as search clicks. Google ranks pages on relevance and usefulness, and rankings grow from helpful content and links that people choose to give. If rankings are your goal, your budget works harder in content and outreach.
The second case is display ad income. Google's AdSense rules hold the publisher responsible for invalid clicks and impressions, and they name paid-to-click, paid-to-surf, autosurf and click-exchange programs as prohibited sources. Paid visitors can also click ad units for reasons that have nothing to do with interest. If your site runs AdSense, the safer choice is to send paid campaigns to pages without ad units.
The third case is a weak offer or a broken page. Traffic magnifies what a page already does: a page that converts poorly at 100 visits will convert poorly at 10,000. Fixing the offer, the speed and the tracking first costs less than any traffic test.
The fourth case is a regulated field. Health, finance and legal topics fall under what Google's quality rater guidelines call "Your Money or Your Life" content, where mistakes can harm people. Ad networks restrict these categories, regulators require disclaimers, and visitors expect proof of expertise before they act. In these fields, search ads and direct deals with trusted publishers usually fit better than interruptive formats, and every landing page needs clear credentials and sources.
Advanced: How to Scale a Traffic Source Without Losing Quality
Scaling breaks more campaigns than launching does. A source that delivers sign-ups at $20 each on $50 a day often delivers them at $60 each on $500 a day. The network fills the higher budget with weaker placements, the same people see your ad more often, and the average quality drops while the dashboard shows healthy volume.
The cause is that every source is a mix of better and worse placements. A small budget buys the best of them, and a large budget buys the rest. The strategies below protect quality as volume grows.
Optimize at the source or placement level
Most ad networks report results by source or placement ID, the code for each site or zone that shows your ad. Averages across all sources hide a wide spread, so one placement can deliver most of your key events while ten others deliver none. Pausing the weak ones and raising bids on the strong ones works because it moves budget from audiences that ignore you to audiences that respond.
Match each landing page to the visitor's mindset
A search visitor expects an answer, a native visitor expects an article, and a pop-under visitor expects nothing at all. One landing page for all three wastes at least two of them. A short, clear page with one message and one action suits interruptive formats, while a longer guide suits native readers. The match works because the page answers the question the visitor had at the moment of the click.
Measure incremental lift with a city holdout
Click-based reports show what visitors did on your site, but not what the campaign added overall. A city holdout answers that question: you run the campaign in one city, keep a similar city as a control and compare branded searches in Search Console, direct visits and sales between the two. The difference is the lift the campaign created beyond its own clicks, which is the number that justifies a larger budget.
Build remarketing audiences from engaged visitors only
Remarketing shows ads again to people who visited your site. An audience of every paid visitor includes many people who left in seconds, while an audience of engaged sessions includes people who read, scrolled or clicked. A second touch to people who already showed interest converts better than a first touch to strangers, so engaged visitors are the part of bought traffic that keeps its value longest.
Scale in steps you can measure
Large budget jumps reset what you know about a source. Raising the budget in steps, for example doubling it only after the cost per key event has held steady for a full week, keeps each step readable. Quality, relevance and transparency stay the guardrails at every step, because a source that grows by lowering quality only grows its cost.
Frequently Asked Questions About Buying Website Traffic
Is it safe to buy website traffic?
Buying traffic is safe when the visits come from real ad placements, you can tag them with UTM parameters, and your own analytics confirms the pattern. It becomes risky when the seller hides the source, guarantees engagement or promises rankings. The verification table above gives you a way to check any provider within the first days of a campaign.
Does buying website traffic help SEO?
No. Paid visits do not come from search results, so they do not count as search clicks and do not raise rankings. Bought traffic helps SEO work only indirectly: it shows you which headlines and pages hold attention, and those findings can guide the content you build for search.
What is the cheapest way to buy website traffic?
Pop-under and push ads offer the lowest price per visit, at about $1 to $6 and $10 to $100 per 1,000 visits in the US. The cheapest route for your goal, however, is the one with the lowest cost per key event, and that can be a more expensive format with more engaged visitors. The break-even table above shows how to judge this for your profit level.
How much should you spend on your first traffic test?
Your budget should buy enough visits for about 15 conversions for a rough read, or about 60 for a decision. At a 1% conversion rate, that means about 1,500 or about 6,000 visits. Using a micro-conversion with a higher rate, such as a pricing-page click, cuts the size and the cost of the test.
How can you tell bot traffic from real visitors?
Bot traffic is regular, and human traffic is uneven. Bots often arrive at the same rate around the clock, use few device and browser types, cluster in data center locations and show nearly identical engagement. Real visitors follow local daytime, use many devices, spread across the cities you targeted and behave in very different ways on the page.
Can you buy traffic for one city or one device type?
Yes. Search, social and many display, native and managed platforms let you target a country, a region or a single city, and desktop, mobile or both. City-level targeting suits local launches and holdout tests, because it lets you compare a targeted city with a similar city that received no paid visits.