Have you ever wondered exactly what people are doing when they visit your site? Which images they’re clicking on, which buttons they hover over, and which bits of text they read? Heatmaps and session recording offer these insights and can provide you with valuable data for refining your site’s UX.
Just like with A/B testing or testing a new market, you’ll need to get just enough traffic to gain some statistically relevant data while balancing the costs. Here’s how to go about it:
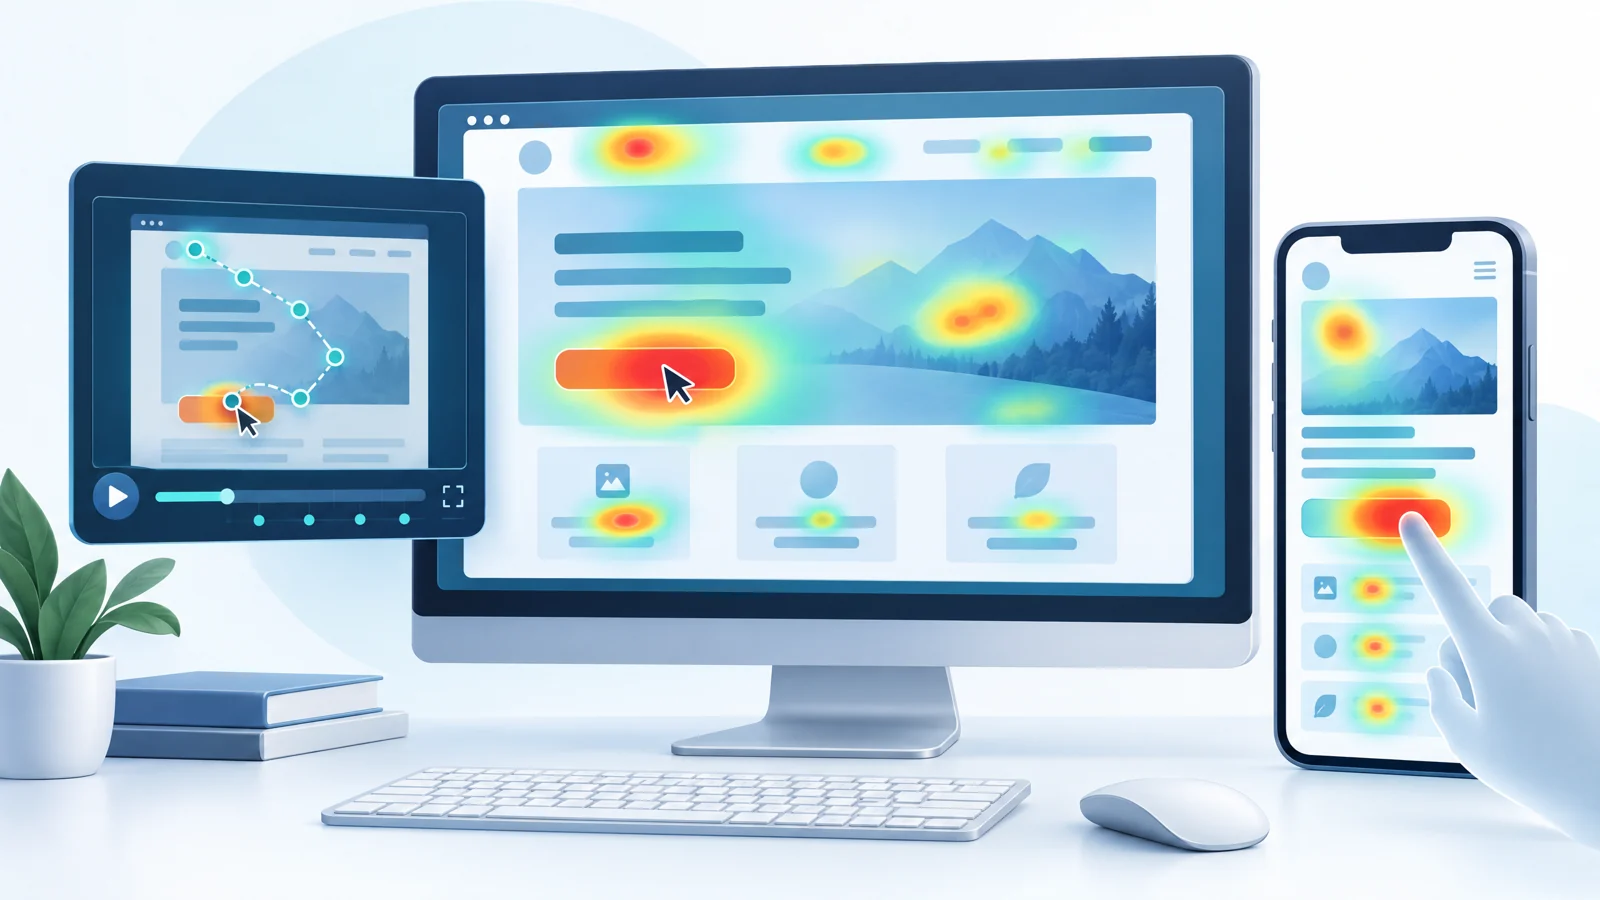
What Are Heatmaps and Session Recordings?
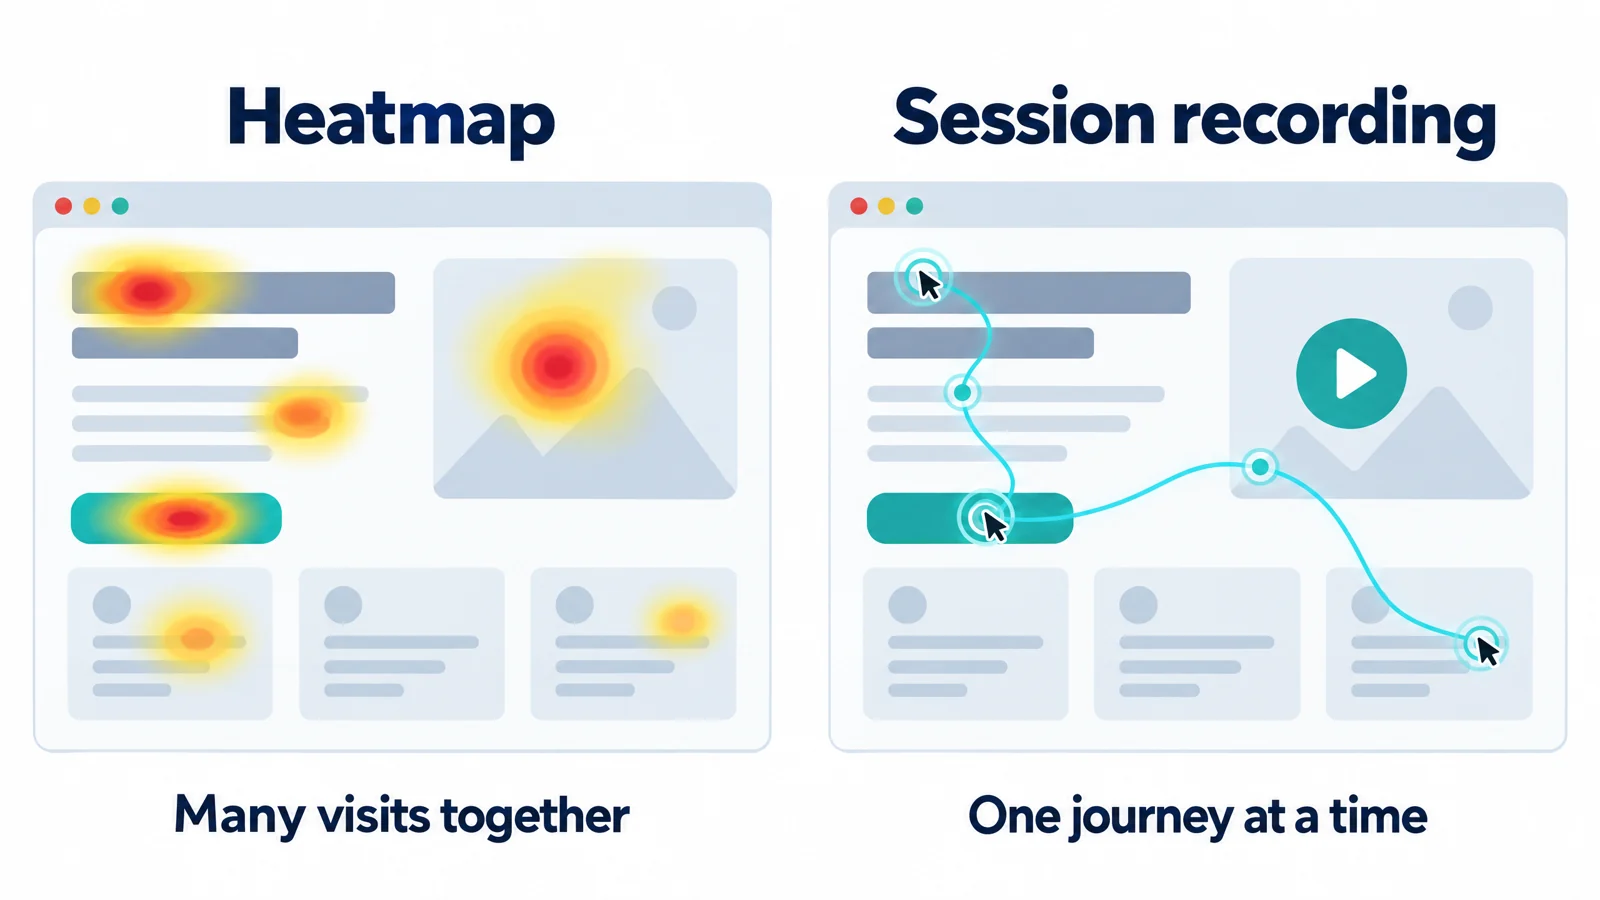
Heatmaps and session recordings are a fantastic way of testing how real people interact with your website.
- Heatmaps produce a colour-coded image of your page, highlighting where people hovered, clicked, and spent time reading. This is formed from an aggregate of all your visitors, giving insights into how people generally interact with your page. The “warmer” the color of the highlighted section, the more attention it got.
- Session recordings, as the name suggests, give you a video of how a given (but anonymous) user interacted with your page. This allows you to track user journeys through your page accurately, covering things like mouse clicks, how they fill in forms (or how they hesitate while doing it), and how deeply they scroll.
This information allows you to see what people are interacting with on your site. That means you can test whether people are clicking your call-to-action buttons, reading your text, and scrolling down your page. It also means that you can identify if they’re clicking on something like a static image and expecting it to do something or skipping sections, and rectify the problem.
What Can I Use Them To Test?
Both heatmaps and session recordings allow you to test any aspect of your pages, gathering real-world data about how people interact with your sites.
Let’s say you wanted to test the color selection for your call-to-action button. At the moment it’s red, but you wonder if green might attract more clicks. First, you set up your heatmap plugin and gather data about the current state of affairs. Then you make the change and compare how it changes how people interact with the button you’re testing. You can then implement the most effective one.
Similarly, if you wanted to test how effective your headers are at encouraging scrolling, looking through a few session recordings could give you valuable insights. Comparing a few before-and-after sessions should let you see which version encouraged people to keep reading further down the page.
Other things you could test include:
- Whether people are clicking your images
- How people interact with your forms- are they hesitating on a particular section or misinterpreting your prompts?
- “Rage clicks”- are people repeatedly clicking on something, suggesting either a broken link, unresponsive button, or a slow-loading element?
- Attention zones- where people linger on your site and where attention drops off
- Navigation interactions- how people navigate through your page and any areas they’re skipping over
How to Get Traffic To Run Your Heatmaps and Session Recordings Tests
Now that we’ve covered what you can test, we’ll look at how to set up your tests and drive enough traffic towards the page to gain enough data to make informed decisions about your UX.
While you could absolutely do this over the long term via organic traffic, finding pain points on your pages should be a priority, as a suboptimal user experience might be turning off potential genuine customers before they ever get anywhere near your checkout.
The quickest way to generate traffic tends to be via paid ads, so that’s what we’ll explore.
How Much Traffic Do I Need To Run The Tests?
There’s no single answer to how many visits you need for a heatmap or session recording- in fact, the truth is the more, the better. That being said, it has to be balanced between the cost of acquisition, the conversion rate, the time it takes to run your tests, and numerous other factors. We’re looking for actionable insights, and that means getting results relatively quickly without sacrificing statistical relevance by basing our actions on outliers and incomplete data.
We’ll also have to think about which elements we’re actually looking at. While a general question of “how do people interact with my site” might need relatively few visits, something more specific will need more. For example, if you want to test how effective a particular button is, you’ll need a statistically relevant number of clicks on that particular button.
On top of this, there is one overriding caveat: too few sessions will produce unreliable information, as individual visitors might act unexpectedly. Ideally, we want 200+ clicks on the element that we’re testing (with more allowing more confidence), meaning that the total number of sessions will vary pretty massively, depending on how prominent the element you’re testing is.
How Much Traffic Do I Need for a Heatmap?
Heatmaps aggregate the behaviour of all your visitors into a simple graphic with areas that attract the most focus in “warmer” colours and those with less in cooler. The more sessions your site gets, the more accurate your data will be. That being said, the pressures of both time and budget mean that we need to be able to work out a number that will give us a reasonable amount of certainty relatively quickly.
That formula might look something like:
Required Sessions = Target Clicks on the Element ÷ Expected Click Rate of the Element
The click rate here is the share of sessions that click the element (clicks ÷ sessions), written as a decimal. It isn’t the click-through rate of your ads.
This formula lets us work out what our target traffic acquisition is to test a given element of our page, say a button or how effective our headings are at encouraging further scrolling. As a general rule of thumb, a large, prominent key element such as a Call To Action button will require less traffic for a statistically relevant test than something more obscure like a navigation option hidden away in the 3rd layer of a menu.
For example, if we want 200 clicks on a Call To Action button that around 5% of visitors click, we need 200 ÷ 0.05 = 4,000 sessions. A navigation option that only 0.5% of visitors click would need 200 ÷ 0.005 = 40,000 sessions to collect the same 200 clicks.
Margin of Error
Of course, if everyone responded to your target element the same, there would be no need to run tests in the first place- it would either work or it wouldn’t. This means we need to factor in a certain wiggle room around our results to account for people who don’t act as we expect. This includes scroll maps: someone either scrolls deep enough to see the element or they don’t, and that yes-or-no split is exactly what the formula measures.
For every type of heatmap, we’ll use the formula:
Margin of Error = Z × √(p × (1 − p) ÷ n)
This allows us to work out our margin of error, expressed as a decimal (simply multiply by 100 to work it out as a percentage). Z is our value tied to the confidence level we’re aiming for (1.96 giving the industry standard 95% confidence), and p is our sample proportion, the percentage of people who interacted with our target element, written as a decimal (so 40% becomes 0.4). n is simply our sample size- the larger, the more accurate our final results will be.
This formula allows us to apply a fairly accurate confidence rating to our findings.
For example, if 40% of 300 desktop sessions reach our pricing table, our margin of error is 1.96 × √(0.4 × 0.6 ÷ 300) = 0.055, or 5.5 percentage points either way. In other words, the real figure is most likely somewhere between 34.5% and 45.5%.
The same formula shows what the 200 clicks from our earlier example give us. For a button clicked by 5% of 4,000 sessions, the margin of error is 1.96 × √(0.05 × 0.95 ÷ 4,000) = 0.007, so we know the button’s click rate to within about 0.7 percentage points.
We can also flip the formula around to work out how many sessions we need before we start:
Required Sessions = Z² × p × (1 − p) ÷ (Margin of Error)²
If we want to know how far people scroll to within 5 percentage points, and we have no idea yet what share will reach the element, we use 0.5 for p, as this gives the largest and safest number: 1.96² × 0.5 × 0.5 ÷ 0.05² = 385 sessions. For a button that around 5% of visitors click, where 2 percentage points either way is precise enough, we need 1.96² × 0.05 × 0.95 ÷ 0.02² = 457 sessions.
That is far fewer than the 4,000 sessions needed for 200 clicks, so it pays to decide how precise your answer really needs to be before you set your traffic target. Remember that these numbers apply to each device type separately, as we’ll see below.
How Much Traffic Do You Need For Session Recordings
When it comes to drawing solid conclusions from session recordings, it’s another case of the more the merrier, but we’re still constrained by the need to get results within a given timescale and without blowing our entire marketing budgets on testing.
It’s also worth noting that session recording provides much more qualitative data rather than quantitative. When we turn to this tool, we’re mostly looking for answers to questions like “why aren’t people converting on this form”, and that can show up in surprisingly few sessions.
We’ll also have to factor in the fact that not every session will be a valid test of how people interact with our site. Visits from your own team, bots or crawlers or sources that we’re excluding for whatever reason need to be discarded from our equations. We’ll also have to factor in the fact that not everyone will agree to have their session recorded at all.
That gives us:
Required Traffic = Target Recordings Needed ÷ (Event Rate × Recording Rate × Valid Session Rate)
Here the event rate is the share of visits that show the behaviour we want to study. The recording rate is the share of visits that actually get recorded: the share of people who agree to be recorded, multiplied by your tool’s sampling rate if it doesn’t record every session. The valid session rate is the share of recordings left once we’ve discarded our own team, bots and excluded sources. All three are written as decimals.
To get away from the abstract mathematics, let’s put it into a solid example: why aren’t people completing your mailing list sign-up form?
Let’s say we want somewhere around 15 filtered sessions that we will actually watch, giving us a target recording value of 15. Let’s say that 20% of visitors start to fill in the form but don’t submit it, forming our event rate expressed as a decimal (0.2). We’ll also say (just to keep the maths simple) that 60% of visitors agree to be recorded and our tool records every one of them, giving a recording rate of 0.6, and that 90% of those recordings are still valid once we’ve removed our own team and bots, giving a valid session rate of 0.9.
That gives:
Required Traffic = 15 ÷ (0.2 × 0.6 × 0.9) = 15 ÷ 0.108 = 139
This means we need about 139 visits to get our 15 recordings to watch.
If your tool only records a sample of sessions, that sampling rate goes into the recording rate too. At a 10% sampling rate, the recording rate drops to 0.6 × 0.1 = 0.06, and we’d need 15 ÷ (0.2 × 0.06 × 0.9) = 1,389 visits, so it’s worth checking your tool’s recording limits before you set your budget.
Why 15? If a particular problem shows up in 20% of the recordings of people abandoning the form, the chance of seeing it at least once is:
Chance of Seeing a Problem = 1 − (1 − Problem Rate)ⁿ, where n is the number of recordings we watch
With 15 recordings, that’s 1 − 0.8¹⁵ = 0.965, or a 96.5% chance of spotting it. If the problem only shows up in 10% of the recordings, the same 15 recordings give us 1 − 0.9¹⁵ = 0.79, so it’s worth watching a few more.
Again, this will vary pretty hugely depending on the question you’re asking. A bug that affects 1% of visitors will need a lot more traffic to analyse than something that affects nearly everyone who visits. To have a 95% chance of catching a bug like that even once, we’d need around 300 recordings (1 − 0.99³⁰⁰ = 0.95). We can’t filter for a bug we haven’t found yet, so the event rate is 1, which gives 300 ÷ (1 × 0.6 × 0.9) = about 556 visits.
Targeting Your Traffic
As we’re dealing with testing using paid traffic, we’ve got a lot of control over who makes up our sessions via our ad network’s targeting.
SparkTraffic, an advertising network that sends real people to your page through display, native and pop-under placements on partner publisher sites, lets you choose the country, region or city for each campaign, and whether your ads show on desktop, mobile or both. That means you can fill one device segment of your heatmap with targeted website traffic and stop as soon as you reach the sample size from the formulas above.
Ideally, you want this to match your usual targeting relatively closely. This means that your usual geofencing, interests, etc. should be targeted, allowing you to test how your normal audience reacts to your site. That being said, it can be worth loosening it slightly to encourage more clicks quickly and test how a more general audience reacts.
If we loosen our targeting too much, we run the risk of ending up with very accurate data about how the wrong people interact with our page.
Setting Your Advertising Budget
We’re aiming for a reasonable amount of traffic generation in a relatively short period of time, so you might want to set this to a higher level than for other forms of testing. This should allow you to gather enough traffic and conversions to draw solid conclusions from, but it runs the risk of making your testing prohibitively expensive.
The key to avoiding overspend is to keep a close eye on your analytics and stop the campaign when you hit enough traffic for your results to be judged reliable- use the formulas above to work out your target. Once you hit the target, stop the campaign and analyze the results.
This allows you to balance costs vs the need for statistically relevant data collection and conduct your tests relatively quickly too.
Testing on Desktop vs Mobile Visits
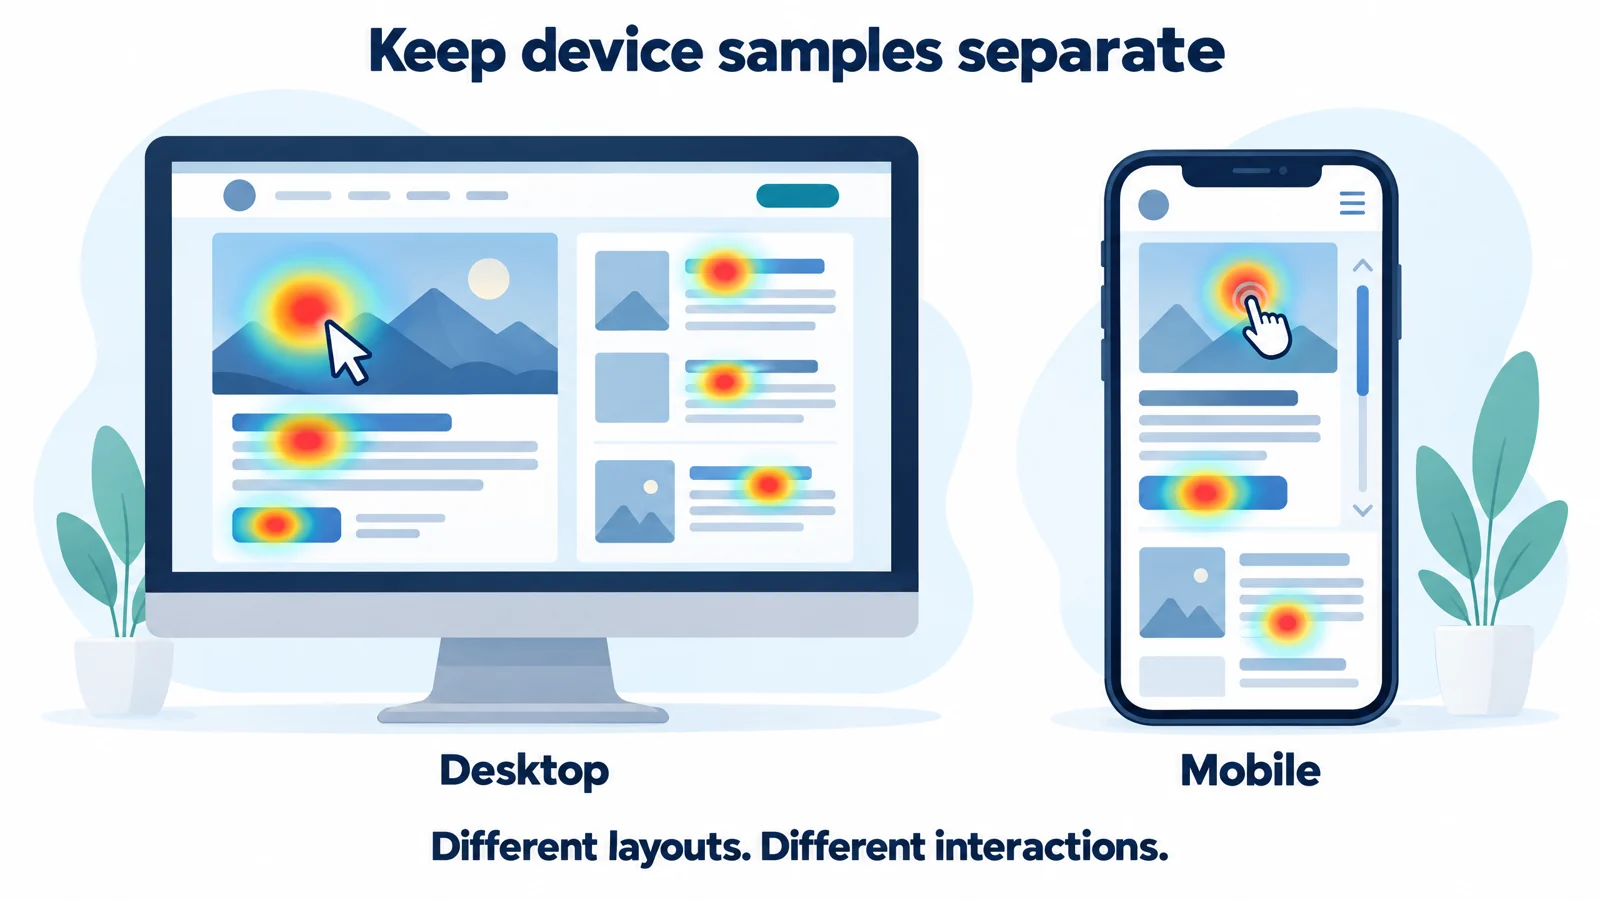
How people interact with websites varies pretty massively depending on which device type they happen to be browsing on, and that means that our tests have to factor this difference in behaviour into their results.
Heatmaps record interactions, and while some are pretty similar between mobile and desktop visits (clicks being basically equivalent to taps, etc.), others are unique to each type of device. For example, a mobile heatmap might factor in behaviours like pinch zooming on an image that there’s no real equivalent to if you’re using a laptop. On the flip side, cursor hovering can often be read as a proxy for where someone is focusing on a desktop, but there's no real equivalent on a mobile.
It’s also possible that a bug that you want to test will appear on desktop sessions but not mobile or vice versa, and, let’s not forget that the layout of your page can change pretty dramatically between device types.
This means that we need to keep our traffic sources separate and look at our heatmaps and session recordings as different entities based on which device our visitors were using. You could also separate out traffic from different browsers, should you be finding that you have a particular issue with Chrome or Firefox.
The simplest way to account for these differences is by setting our paid ads targeting to only display our ads to people using a certain device type or carefully filtering our maps and session recordings by device type in the platform dashboard, depending on what exactly we’re trying to test. The difference in cost can be large. If 60% of your visits arrive on mobile, collecting the 385 desktop sessions from our scroll example means buying 385 ÷ 0.4 = 963 visits, while desktop-only targeting needs just 385.
Common Issues and How to Solve Them
While session recordings and heatmaps can give you a huge amount of detail on how people are interacting with your webpages, they’re only as good as your setup and interpretation, and are susceptible to a couple of major problems.
Problems with Sample Sizes
Firstly, there’s the risk of drawing conclusions based on a few outliers. Checking in on a heatmap before enough people have visited the site or picking a session recording at random could lead you to false conclusions based on a single visit that doesn’t match the trends you’re really examining. However you set up your UX, someone will find something tricky or confusing and provide an outlier example.
The solution is simple: ensure that you are only drawing conclusions from tests which have reached a statistically relevant number of examples.
Problems with Overspend
On the flip side of our last problem, which was mostly based on not having enough visits to draw solid conclusions from, there’s also the risk of paying for too many visits. While this will make your heatmaps more reliable, there is always a balance to be struck between cost and results. Let’s face it, paid ads are expensive.
Avoiding this problem is a matter of keeping an eye on your numbers and stopping the campaign (and therefore stopping the costs from rising) at the right moment. Set a clear target number of conversions that you want to examine at the start of the process and stop as you get close to it.
Problems Arising From Traffic Sources
“Paid ads” is a fairly nebulous term, incorporating everything from traditional banners through search ads and pop-unders, and each type can lead to different results in your testing. This last example can present particular problems when it comes to session length, as they open (starting the session) and sit “under” the active tab, vastly extending the length of your recordings and distorting your heatmaps.
The solution is to implement UTM tags into the URLS attached to each ad type you’re running to power your tests. This allows you to split your results by source, with each ad type being recorded separately, allowing you to correct for these anomalies.
Problems With Consent and Privacy
We live in an ever more data-conscious world, with people taking their privacy seriously. Laws, such as the EU’s GDPR and ePrivacy Directive and various equivalents around the world, are becoming more and more common and constantly being tightened. In most places, people have the right to opt out of their data being processed, should they wish to.
There’s no simple solution to this problem, beyond asking for consent via a banner when people first navigate to your site and explaining the purpose of collecting data in your privacy policy. You should also outline how you plan on using the data and protecting it from security threats here. Ultimately, people’s browsing data belongs to them, and you have a legal responsibility to handle it carefully.
Conclusion: Getting Enough Traffic To Run Valid Tests
If you’re looking to improve your UX and help people make the most of your site, building heatmaps and checking session recordings is the way to identify the parts that are tripping them up and what’s working exactly as intended.
Naturally, you don’t want to run the risk of annoying your real customers with a UX that needs improvements. Paying for enough traffic to test your page, without overshooting, means you can get around this issue. If they turn into real customers, so much the better.
Aim to balance costs with gathering enough data to make solid decisions; avoid the temptation to read too much into outliers and make sure you’re examining a particular issue rather than simply spying on how people use your site and both heatmaps and session recordings can be invaluable tools.