
Three numbers sit at the top of almost every analytics dashboard: users, sessions, and page views. They look similar, they usually move together, and many teams use them as if they meant the same thing. They do not, and the gap between them is where most reporting mistakes begin.
The stakes are higher than they look. Wikipedia notes that more than half of all web traffic is generated by bots, and the Pew Research Center reports that 91% of US adults own a smartphone, so many of your visitors reach you from more than one device. Both facts change what your user count really measures. In a training example from the US government's Digital Analytics Program, the same homepage in the same week showed either 11,499 or 33,231 page views, depending on which report column the analyst chose.
This guide explains what each metric counts, how the three work together, why the totals never add up neatly, what distorts them today, and how to report them honestly. Every main section ends with a practical step you can apply to your own reports this week.
What Users, Sessions, and Page Views Actually Count
Most confusion starts with language. In meetings, people say "visitors," "traffic," "hits," and "views" as if they were synonyms, and different analytics tools use different labels for similar ideas. A founder hears "we had 40,000 visitors last month" and pictures 40,000 people. The analyst who said it may have read the sessions column, which counts visits, not people.
The old term "hits" shows how long this problem has existed, and the history of website traffic measurement is full of similar shifts. As Wikipedia's page view article explains, a hit is any file request to a server, so one page with ten images can produce eleven hits. Page views replaced hits because they track what a person actually opens. Sessions and users then added two more layers on top, and each layer answers a different question.
The old term "hits" shows how long this problem has existed, and the history of website traffic measurement is full of similar shifts. As Wikipedia's page view article explains, a hit is any file request to a server, so one page with ten images can produce eleven hits. Page views replaced hits because they track what a person actually opens. Sessions and users then added two more layers on top, and each layer answers a different question.
Page views: a record of every page load
A page view, which GA4 reports as "Views," is recorded every time a page loads or the browser history changes on your site. According to Google's developer documentation on page views, the page_view event fires automatically on each load, and enhanced measurement also fires it when a single-page application changes the URL without a full reload. Reloads count too. If a reader refreshes your pricing page three times, you get three views.
Page views answer a content question: what do people open, and how often? They are the most detailed of the three metrics, which makes them strong for comparing pages and weak for counting an audience.
Page views answer a content question: what do people open, and how often? They are the most detailed of the three metrics, which makes them strong for comparing pages and weak for counting an audience.
Sessions: one visit, bounded by inactivity
A session is a group of interactions that happen during one visit. In Google Analytics, a session starts when someone opens a page and no session is active, and it ends after 30 minutes without activity by default, according to Google's help page on sessions. Wikipedia's entry on web analytics sessions notes that the 30-minute threshold is an industry convention, not a technical law.
Sessions answer a visit question: how often do people come? If a reader opens your site at 9:00, leaves the tab idle until 9:45, and then clicks again, you record two sessions from the same person in the same morning.
Sessions answer a visit question: how often do people come? If a reader opens your site at 9:00, leaves the tab idle until 9:45, and then clicks again, you record two sessions from the same person in the same morning.
Users: a browser identifier, not a person
The user metric is the one most often misread. Analytics tools identify users through a random identifier stored in a cookie or in an app, so a "user" is really one browser on one device. The same person on a phone and a laptop counts as two users. Two people who share one family laptop can count as one.
GA4 offers several user metrics, which Google lists in its user metrics guide: total users, active users, new users, and returning users. Most standard reports show active users in the "Users" column, meaning identifiers that had an engaged session or a first visit in the period. Users answer an audience question: roughly how many distinct browsers did you reach?
GA4 offers several user metrics, which Google lists in its user metrics guide: total users, active users, new users, and returning users. Most standard reports show active users in the "Users" column, meaning identifiers that had an engaged session or a first visit in the period. Users answer an audience question: roughly how many distinct browsers did you reach?
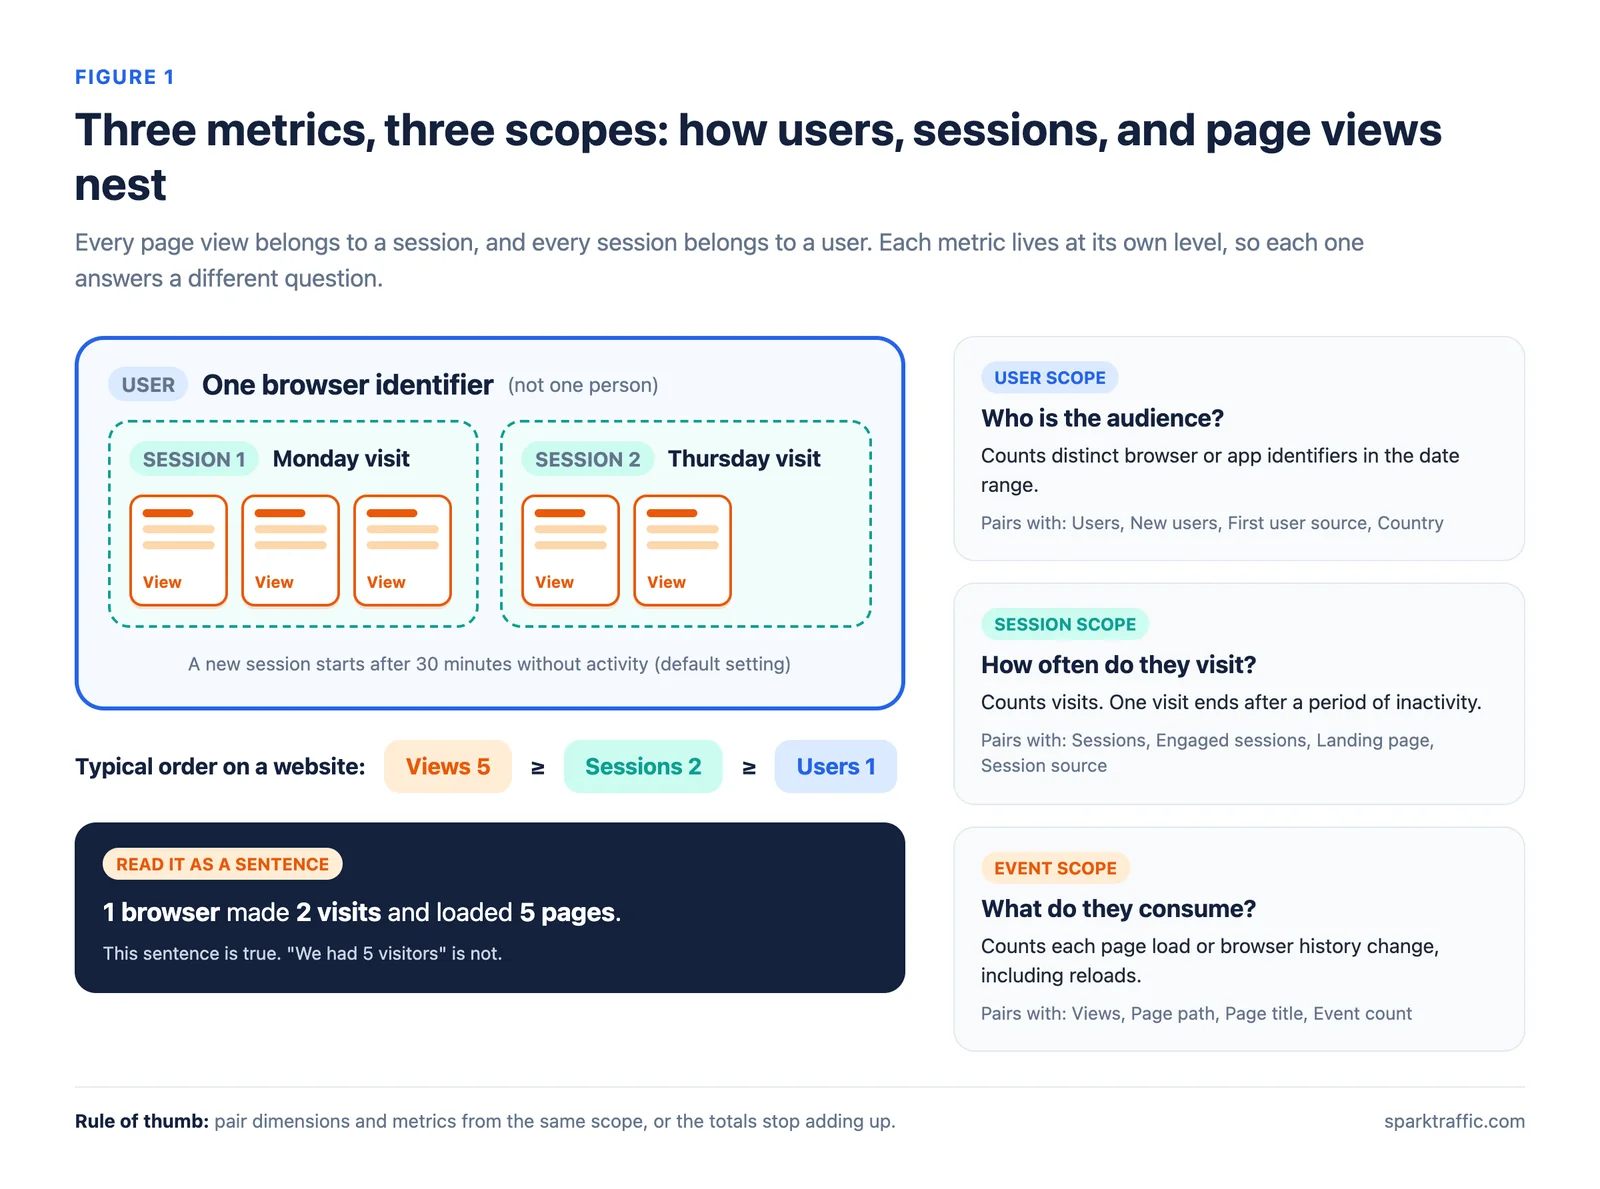
Figure 1. Each metric lives at its own level. Page views sit inside sessions, and sessions sit inside users.
The table below summarizes what pushes each metric up or down. It is a useful reference when a number moves and you need to know where to look first.
Metric
Page views
Sessions
Users
What it counts
Each page load or history change
Each visit
Each browser or app identifier
Scope
Event
Session
User
Resets when
Every new load
30 minutes of inactivity (default)
Cookie deletion, new device, new browser
Pushed up by
Reloads, auto-refresh, duplicate tags
Short timeouts, frequent short returns
Multiple devices, cookie caps, private browsing
Pushed down by
Missing tags, history tracking turned off
Long timeouts, keep-alive pings, blocked tags
User-ID, Google signals, shared devices
Best question
Which content earns attention?
How often do people visit?
How many browsers did we reach?
Practical step: a plain sentence for every report
Before you share a number, you can rewrite it as a sentence that names its unit. "12,000 users" becomes "about 12,000 browsers visited." "18,000 sessions" becomes "those browsers made about 18,000 visits." "54,000 views" becomes "and loaded 54,000 pages." The full version reads: about 12,000 browsers made 18,000 visits and loaded 54,000 pages.
This works because the sentence forces each number to carry its own unit, so nobody can quietly turn browsers into people. It also exposes inflated claims early. If someone says "we had 54,000 visitors," the sentence shows that 54,000 is a count of page loads, not of humans. Keeping real people at the center of the conversation starts with naming them correctly.
This works because the sentence forces each number to carry its own unit, so nobody can quietly turn browsers into people. It also exposes inflated claims early. If someone says "we had 54,000 visitors," the sentence shows that 54,000 is a count of page loads, not of humans. Keeping real people at the center of the conversation starts with naming them correctly.
Reading the Three Metrics Together to See Real Human Interest
Each metric on its own tells a partial and sometimes flattering story. A spike in page views can come from one enthusiastic reader, a broken auto-refresh, or a viral post. A rise in users can mean a new audience, or it can mean that browsers deleted their cookies. A jump in sessions can mean people return more often, or that your timeout setting changed. Judging a site by one of these numbers is like judging a restaurant by the number of plates washed.
The three metrics become useful when you read them as one story about real people. Consider Lena, who shops for trail running shoes over one week. On Monday morning she reads a guide and a product page on her phone, then reloads the product page. Four hours later she returns through a newsletter link. On Wednesday evening she switches to her laptop, reads reviews, adds the shoes to her cart, leaves the tab idle for 45 minutes, and then completes the purchase.
The three metrics become useful when you read them as one story about real people. Consider Lena, who shops for trail running shoes over one week. On Monday morning she reads a guide and a product page on her phone, then reloads the product page. Four hours later she returns through a newsletter link. On Wednesday evening she switches to her laptop, reads reviews, adds the shoes to her cart, leaves the tab idle for 45 minutes, and then completes the purchase.
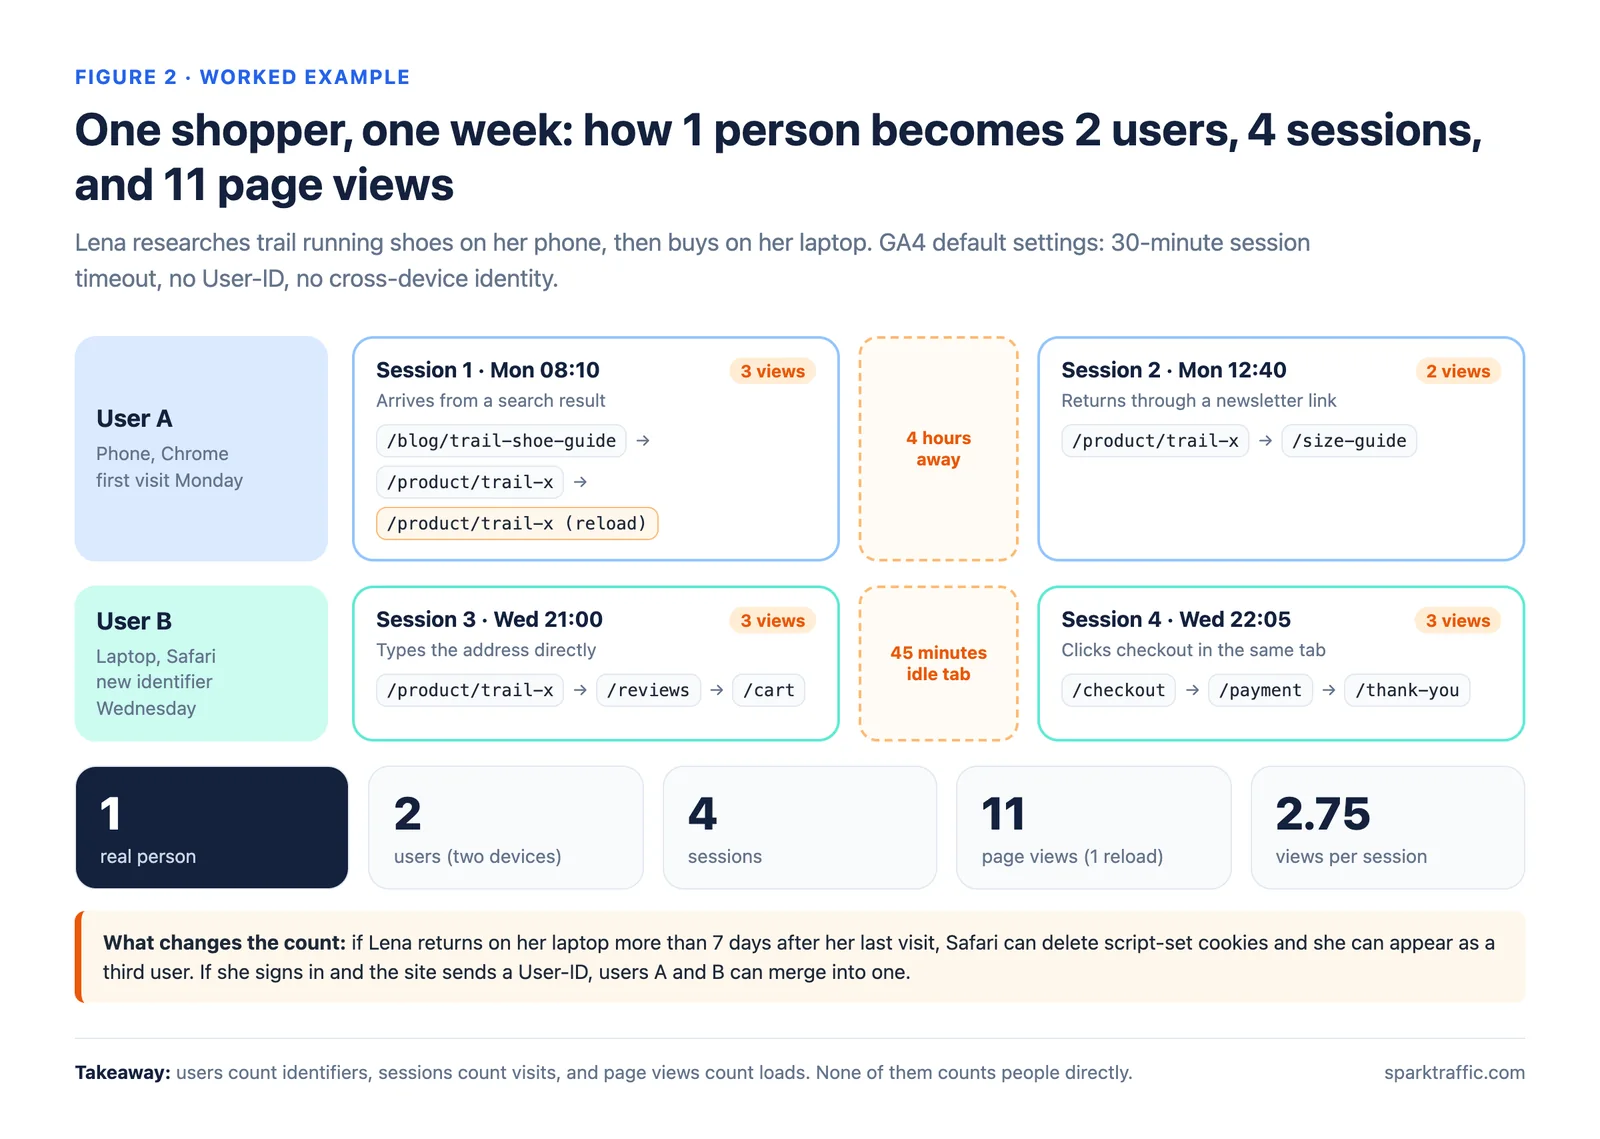
Figure 2. Under default GA4 settings, one shopper appears as 2 users, 4 sessions, and 11 page views.
Each number is correct, and none of them equals one person. The value comes from the relationships between them. Two sessions per user shows that Lena came back. A ratio of 2.75 views per session shows that each visit had depth. The reload appears as an extra view without an extra visit. Together, the three numbers describe a considered purchase by a real shopper, which no single metric could show.
This layered reading is also how you judge whether new visitors care about what you show them. SparkTraffic, an advertising platform that has delivered website visits through ads on partner publisher sites since 2015, is a good example of the approach in practice. Advertisers who run geo-targeted ad campaigns on the platform choose the countries, cities, and devices where their ads appear, follow delivery in a real-time report, and then compare those visits with the sessions, users, and page views in their own analytics. Because the platform reviews every landing page and declines campaigns meant to make a site's audience look bigger to investors, advertisers, or sponsors, the question it helps answer stays practical: what did real people do after they arrived?
This layered reading is also how you judge whether new visitors care about what you show them. SparkTraffic, an advertising platform that has delivered website visits through ads on partner publisher sites since 2015, is a good example of the approach in practice. Advertisers who run geo-targeted ad campaigns on the platform choose the countries, cities, and devices where their ads appear, follow delivery in a real-time report, and then compare those visits with the sessions, users, and page views in their own analytics. Because the platform reviews every landing page and declines campaigns meant to make a site's audience look bigger to investors, advertisers, or sponsors, the question it helps answer stays practical: what did real people do after they arrived?
Practical step: a single "trio" view of your traffic
You can build one GA4 exploration in Explore, using the Free form template, with Session source / medium as rows and five metrics as columns: Users, Sessions, Views, Engaged sessions, and Key events. You then add two ratios, views per session and sessions per user, either as calculated metrics or in a spreadsheet export. Reviewing this view once a week takes about five minutes.
This works because the metrics act as cross-checks on each other. A genuine increase in human interest usually moves all of them in a consistent direction, while a tracking error or a low-quality source moves one number and leaves the others flat. When views climb 40% but sessions and engaged sessions stay level, you know where to look before anyone celebrates.
This works because the metrics act as cross-checks on each other. A genuine increase in human interest usually moves all of them in a consistent direction, while a tracking error or a low-quality source moves one number and leaves the others flat. When views climb 40% but sessions and engaged sessions stay level, you know where to look before anyone celebrates.
Why Your Numbers Never Add Up (and Why That Is Normal)
Sooner or later, someone exports a report, sums a column, and gets a number that disagrees with the dashboard. Daily users added up for a month come out far above the monthly user count. Sessions by page add up to more than the site's total sessions. GA4 shows one figure, the BigQuery export shows a slightly different one, and the server log shows a third. Teams often spend days hunting for a bug that does not exist.
Most of these gaps come from scope. Every metric and dimension belongs to a level: user, session, or event (the digital.gov training calls the last level "hit"). When you pair a session metric with a page dimension, each row counts the sessions that included that page, so one session that touches three pages can appear in three rows. Google's developer guide on sessions gives a clear example: one visit that goes from /home to /products and back to /home shows 1 session in each page row, so the rows sum to 2 while the true total is 1.
Most of these gaps come from scope. Every metric and dimension belongs to a level: user, session, or event (the digital.gov training calls the last level "hit"). When you pair a session metric with a page dimension, each row counts the sessions that included that page, so one session that touches three pages can appear in three rows. Google's developer guide on sessions gives a clear example: one visit that goes from /home to /products and back to /home shows 1 session in each page row, so the rows sum to 2 while the true total is 1.
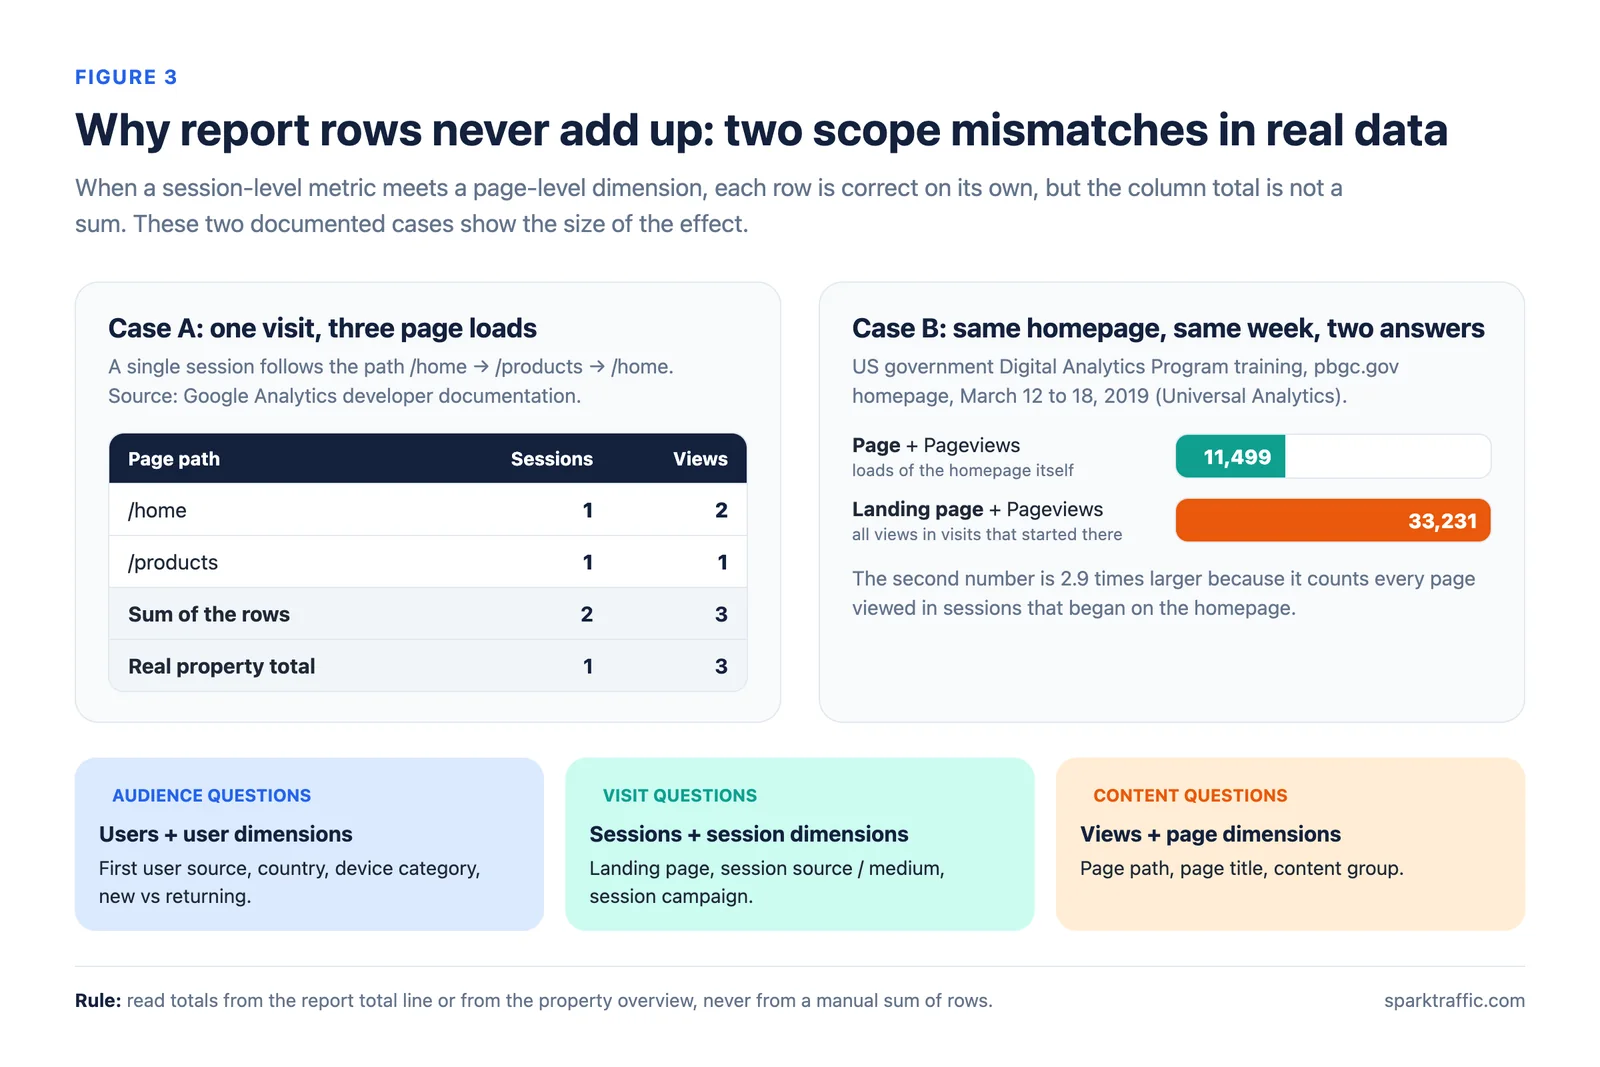
Figure 3. Each row is correct on its own, but a column of session counts by page is not a sum.
The same logic explains the homepage example from the introduction. The 11,499 figure counts loads of the homepage itself. The 33,231 figure counts every page viewed in sessions that started on the homepage. Both are correct answers to different questions, and the second is 2.9 times larger. Google's guide makes the same distinction for GA4: "Sessions with page path" counts sessions that visited a page at least once, while the Landing page + query string dimension counts sessions that started there.
Users behave the same way across time. A loyal reader who visits on 20 days of a month counts once in the monthly user total but 20 times if you add up the daily totals. A site with 1,000 daily users for 30 days does not have 30,000 monthly users. It may have 6,000 if most of its readers return often.
A smaller source of difference is estimation. GA4 does not count every session ID one by one. It estimates the number of unique session IDs with an algorithm called HyperLogLog++, which Google adopted in 2021. Wikipedia's HyperLogLog article explains that this family of algorithms trades a small, predictable error for large savings in memory. Google's help page on sessions shows a report with 1,463 sessions against 1,501 in the raw BigQuery export, a gap of about 2.5%, while both sources show the same 25% week-over-week trend.
Practical step: the scope-matching rule and three reporting habits
You can avoid most of these arguments with one rule: pair each metric with dimensions from the same scope. Audience questions use users with user dimensions such as first user source or country. Visit questions use sessions with session dimensions such as landing page or session source. Content questions use views with page dimensions such as page path or page title.
Three habits make the rule stick:
Three habits make the rule stick:
- Totals come from the total line of a report or the property overview, never from a manual sum of rows.
- Monthly and quarterly users come from their own query, not from adding daily figures.
- Comparisons across tools focus on trends, with small level differences accepted, since each tool counts by its own rules.
These habits work because they move the team's attention from "which number is right" to "which question does this number answer." That shift saves time, and it makes reports more honest, because nobody presents a summed figure as the size of an audience.
What Distorts Each Metric Today
A lot of advice about these metrics was written for Universal Analytics, the previous version of Google Analytics, which stopped processing data for standard properties in July 2023. Some of that advice is now wrong. Many guides still say a session ends at midnight or when a visitor arrives from a new campaign. That was true in Universal Analytics, but Google confirms that GA4 sessions are not restarted at midnight or when new campaign parameters appear. This is one reason GA4 usually shows fewer sessions than Universal Analytics did for the same traffic.
Browsers, privacy laws, and site architecture have changed as well. Each of the three metrics now has its own typical distortions. Knowing them helps you read changes calmly and separate real shifts in human behavior from noise in the measurement.
Browsers, privacy laws, and site architecture have changed as well. Each of the three metrics now has its own typical distortions. Knowing them helps you read changes calmly and separate real shifts in human behavior from noise in the measurement.
Users: cookies, devices, consent, and identity
User counts drift upward when identifiers disappear. Safari's tracking prevention, documented by the WebKit project, deletes cookies created by JavaScript after 7 days without user interaction with the site. It can shorten that window to 24 hours when a visitor lands through a decorated link from a domain that Safari classifies as a cross-site tracker. A reader who returns every two weeks in Safari can count as a new user on each visit. In the Lena example, a return visit on her laptop eight days later could turn her into a third user.
User counts also drift downward. In the European Union, the ePrivacy Directive requires prior consent for non-essential cookies, so visitors who decline may not appear as identifiable users, depending on your consent setup. Features such as User-ID for signed-in visitors and Google signals merge identifiers across devices, which lowers user counts further. The result is that a change in your user count can reflect a change in identity rules rather than a change in your audience. A similar blind spot affects visits from AI assistants, which often arrive without referrer data, as our guide to AI traffic attribution explains.
User counts also drift downward. In the European Union, the ePrivacy Directive requires prior consent for non-essential cookies, so visitors who decline may not appear as identifiable users, depending on your consent setup. Features such as User-ID for signed-in visitors and Google signals merge identifiers across devices, which lowers user counts further. The result is that a change in your user count can reflect a change in identity rules rather than a change in your audience. A similar blind spot affects visits from AI assistants, which often arrive without referrer data, as our guide to AI traffic attribution explains.
Sessions: timeouts, midnight, and keep-alive pings
Session counts depend on settings that few people check. The session timeout can be changed in GA4 up to 7 hours and 55 minutes, and a longer timeout merges visits that a shorter one would split. Comparing session counts across two properties with different timeouts means comparing different units.
Some sites also send automatic "keep-alive" pings every few seconds to stop sessions from expiring. Google's developer guide advises against this practice, because it creates what Google calls "zombie sessions" that inflate average session duration and make idle sessions appear engaged. For long videos or deep technical guides, Google suggests two cleaner options: a longer session timeout, or progress events that pause when the browser tab is hidden. Both keep the data tied to what a real person is doing.
Some sites also send automatic "keep-alive" pings every few seconds to stop sessions from expiring. Google's developer guide advises against this practice, because it creates what Google calls "zombie sessions" that inflate average session duration and make idle sessions appear engaged. For long videos or deep technical guides, Google suggests two cleaner options: a longer session timeout, or progress events that pause when the browser tab is hidden. Both keep the data tied to what a real person is doing.
Page views: single-page apps, reloads, and bots
Page views are sensitive to how a site is built. On a single-page application, the browser loads one HTML document and swaps content with JavaScript. GA4 records these screen changes through browser history events, but if that setting is off, views are undercounted. If a developer also sends manual page views without disabling the automatic ones, Google's documentation warns that you get duplicates.
Reloads, infinite scroll, and auto-refreshing pages such as live scores or price tickers add views without adding visits. Automated traffic adds them too. GA4 excludes known bots and spiders automatically, but unknown automated traffic can still pass through. A sudden rise in views from one source deserves a closer look before it reaches a report. Our guide on how to spot bot traffic lists the most common warning signs.
Reloads, infinite scroll, and auto-refreshing pages such as live scores or price tickers add views without adding visits. Automated traffic adds them too. GA4 excludes known bots and spiders automatically, but unknown automated traffic can still pass through. A sudden rise in views from one source deserves a closer look before it reaches a report. Our guide on how to spot bot traffic lists the most common warning signs.
Practical step: a quarterly measurement health check
A short quarterly check keeps these distortions visible. Five items cover most of the risk:
- The session timeout and engaged session timer in your data stream settings, recorded in a shared note.
- The enhanced measurement setting for history-based page views, tested by clicking through the site with DebugView open.
- Duplicate tags, confirmed by checking that each page sends one page_view event per load.
- Consent acceptance rates by country, if you serve European visitors.
- Browser share over time, since a rising Safari share can raise new-user counts on its own.
This works because most distortions come from settings and code, which change quietly during site updates and redesigns. A recorded baseline lets you separate a real change in human behavior from a change in how you measure it.
Choosing the Right Metric for the Question You Are Asking
Many reporting errors are not counting errors at all. They are question errors. A team picks the metric that is easiest to find, or the one that looks best, and uses it to answer a question it does not fit. The most common case is conversion rate, where the choice of denominator changes the answer.
Take an online store with 2,000 users, 3,000 sessions, 9,000 page views, and 120 orders in one month. Its conversion rate is 4.0% per session, 6.0% per user, and 1.3% per page view. All three figures are correct. A manager who compares last year's per-session rate with this year's per-user rate will see a 50% improvement that never happened.
Industry context matters too. Ad-supported publishers often sell inventory based on page views, so views carry direct revenue weight and attract the most pressure to inflate. Businesses in health, finance, or legal topics, which Google's quality guidelines group as "Your Money or Your Life" topics, face higher trust standards, and partners read their audience claims more critically. In these fields, a clear definition of each metric is part of basic credibility.
Practical step: question first, metric second
A simple mapping covers most needs:
- Reach ("How many distinct people did we reach?"): users, with the caveat that identifiers overstate people when audiences use several devices.
- Demand ("How often do people come?"): sessions and sessions per user.
- Content consumption ("Which pages earn attention?"): views and average engagement time per page.
- Campaign efficiency ("Did this ad bring interested visitors?"): engaged sessions and key events per session.
- Considered purchases ("Do people buy after several visits?"): key events per user, often over a 30 to 90 day window.
This approach works because each business question has a natural unit. An ad buys a visit, so campaign tests read best per session. A B2B buyer researches for weeks, so lead quality reads best per user. When the unit matches the question, the number stops being decoration and starts guiding decisions.
Ratios That Reveal What Raw Counts Hide
Raw counts grow with traffic, so they tell you more about volume than about quality. A site that doubles its sessions through a new channel can double its page views and still end up with a less interested audience. Ratios remove the volume effect and show the shape of behavior: how deep each visit goes and how often people come back.
Two ratios do most of the work. Views per session measures the depth of one visit. Sessions per user measures return frequency. A third ratio, engagement rate, is the share of sessions that GA4 counts as engaged. According to Google's engagement rate documentation, an engaged session lasts longer than 10 seconds, includes 2 or more page views, or includes a key event.
Two ratios do most of the work. Views per session measures the depth of one visit. Sessions per user measures return frequency. A third ratio, engagement rate, is the share of sessions that GA4 counts as engaged. According to Google's engagement rate documentation, an engaged session lasts longer than 10 seconds, includes 2 or more page views, or includes a key event.
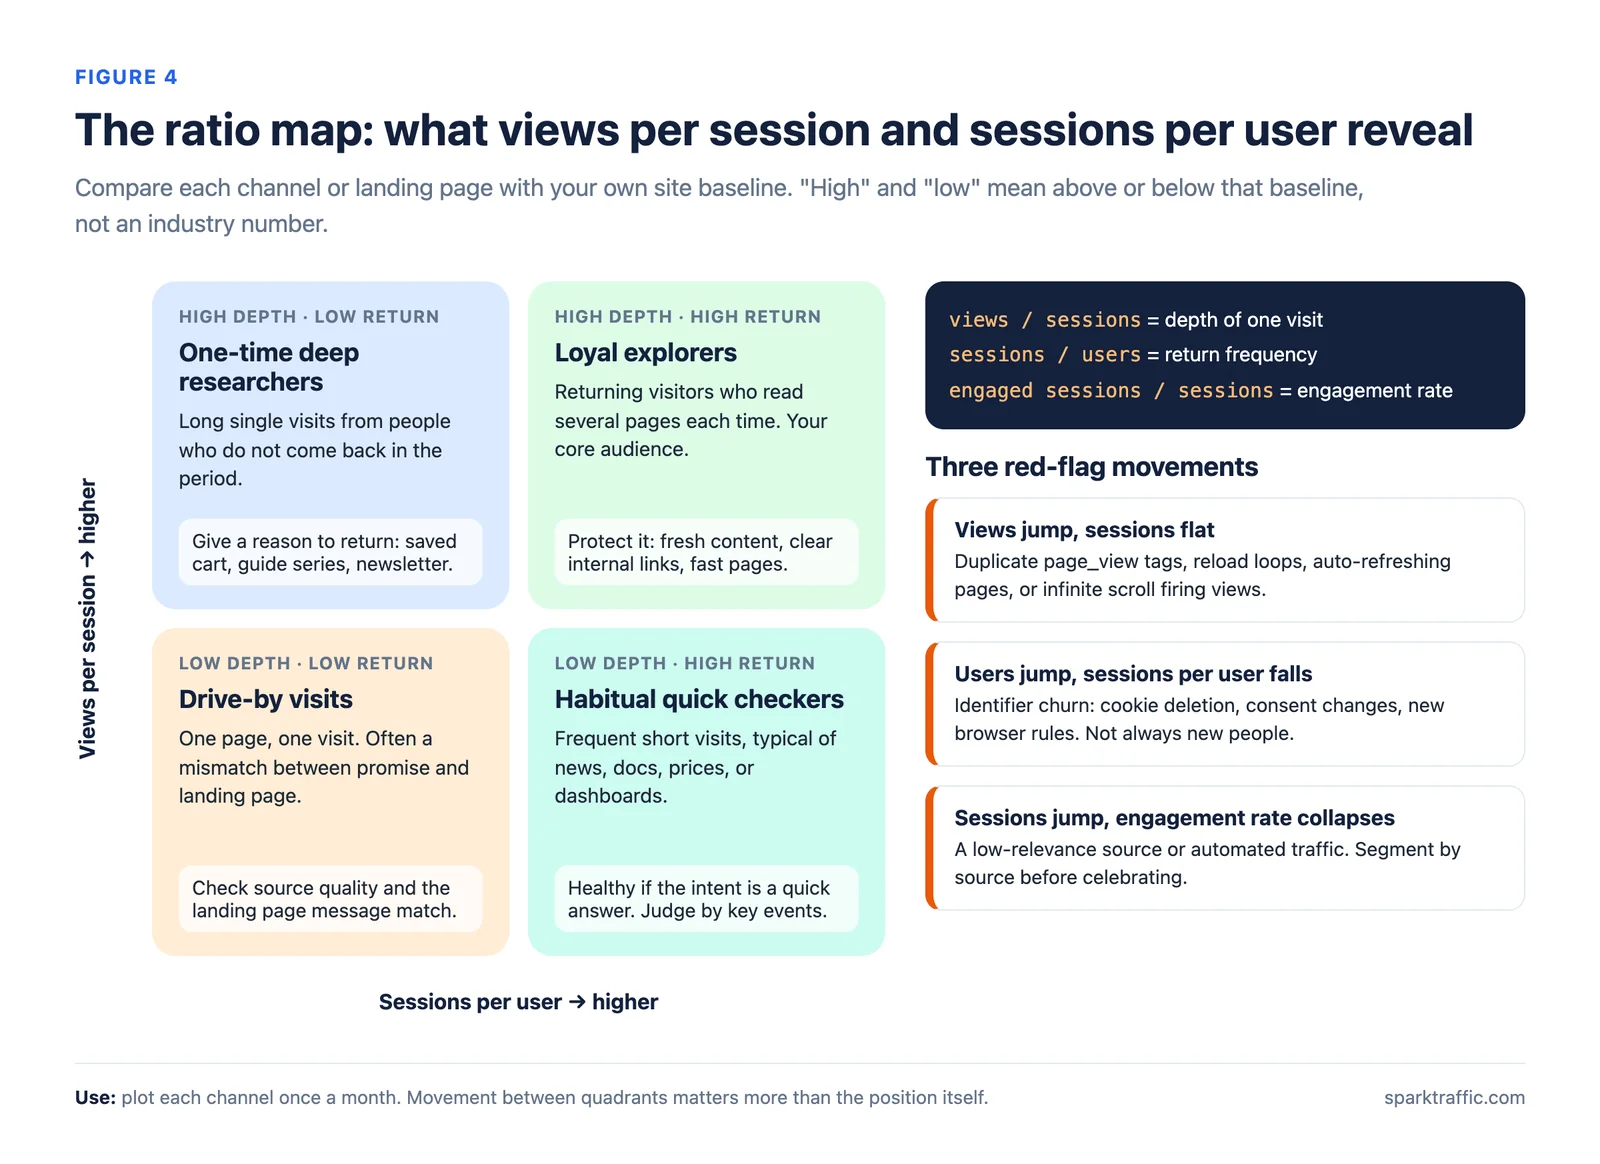
Figure 4. Plotting each channel on two ratios shows the shape of visitor behavior behind the raw counts.
Plotting each channel on these two ratios places it in one of four patterns. Loyal explorers return often and read deeply. One-time deep researchers read a lot once and do not come back. Habitual quick checkers return often for a single page, which is healthy for documentation or price pages. Drive-by visits read one page once, which often points to a mismatch between the ad or search snippet and the landing page.
Movement matters more than position. A newsletter channel that slides from loyal explorers to drive-by visits over three months is telling you that the content no longer matches what subscribers expect. The three red-flag movements in the figure deserve fast attention, because they usually point to a tracking problem or a low-quality source, not a real change in human behavior.
Movement matters more than position. A newsletter channel that slides from loyal explorers to drive-by visits over three months is telling you that the content no longer matches what subscribers expect. The three red-flag movements in the figure deserve fast attention, because they usually point to a tracking problem or a low-quality source, not a real change in human behavior.
Practical step: baselines by channel, not by industry
You can export 90 days of data by session source / medium, calculate the three ratios for each channel, and record the median as that channel's baseline. Each month, you compare every channel with its own baseline and flag any large move, for example more than 20% in either direction.
Channel baselines work better than industry benchmarks because your site design, content type, and audience shape these ratios more than any average can. A recipe site and a software documentation site will never share a "normal" views per session. Comparing yourself with yourself keeps the analysis honest and focused on the people you actually serve.
New channels deserve their own baseline too. If AI assistants send you visitors, you can track ChatGPT traffic in GA4 as a separate channel and compare its ratios with search and email from the first month.
Validating Campaign Traffic With Sessions, Users, and Views
When you pay for traffic through ads, the numbers in the ad platform and the numbers in your analytics never match exactly, and that gap causes anxiety. An advertiser sees 1,000 delivered visits in a campaign report and 880 sessions in GA4, and the first thought is that something is wrong. Usually, nothing is. The two systems count different things at different moments.
Google's troubleshooting guide on clicks and sessions lists the common reasons for the gap. Some people close the page before the analytics tag loads. Some browsers and extensions block analytics. Redirects can strip campaign parameters, so sessions arrive without attribution. Repeated clicks within 30 minutes merge into one session. In regions that require opt-in consent, visitors who decline remove another share.
Google's troubleshooting guide on clicks and sessions lists the common reasons for the gap. Some people close the page before the analytics tag loads. Some browsers and extensions block analytics. Redirects can strip campaign parameters, so sessions arrive without attribution. Repeated clicks within 30 minutes merge into one session. In regions that require opt-in consent, visitors who decline remove another share.
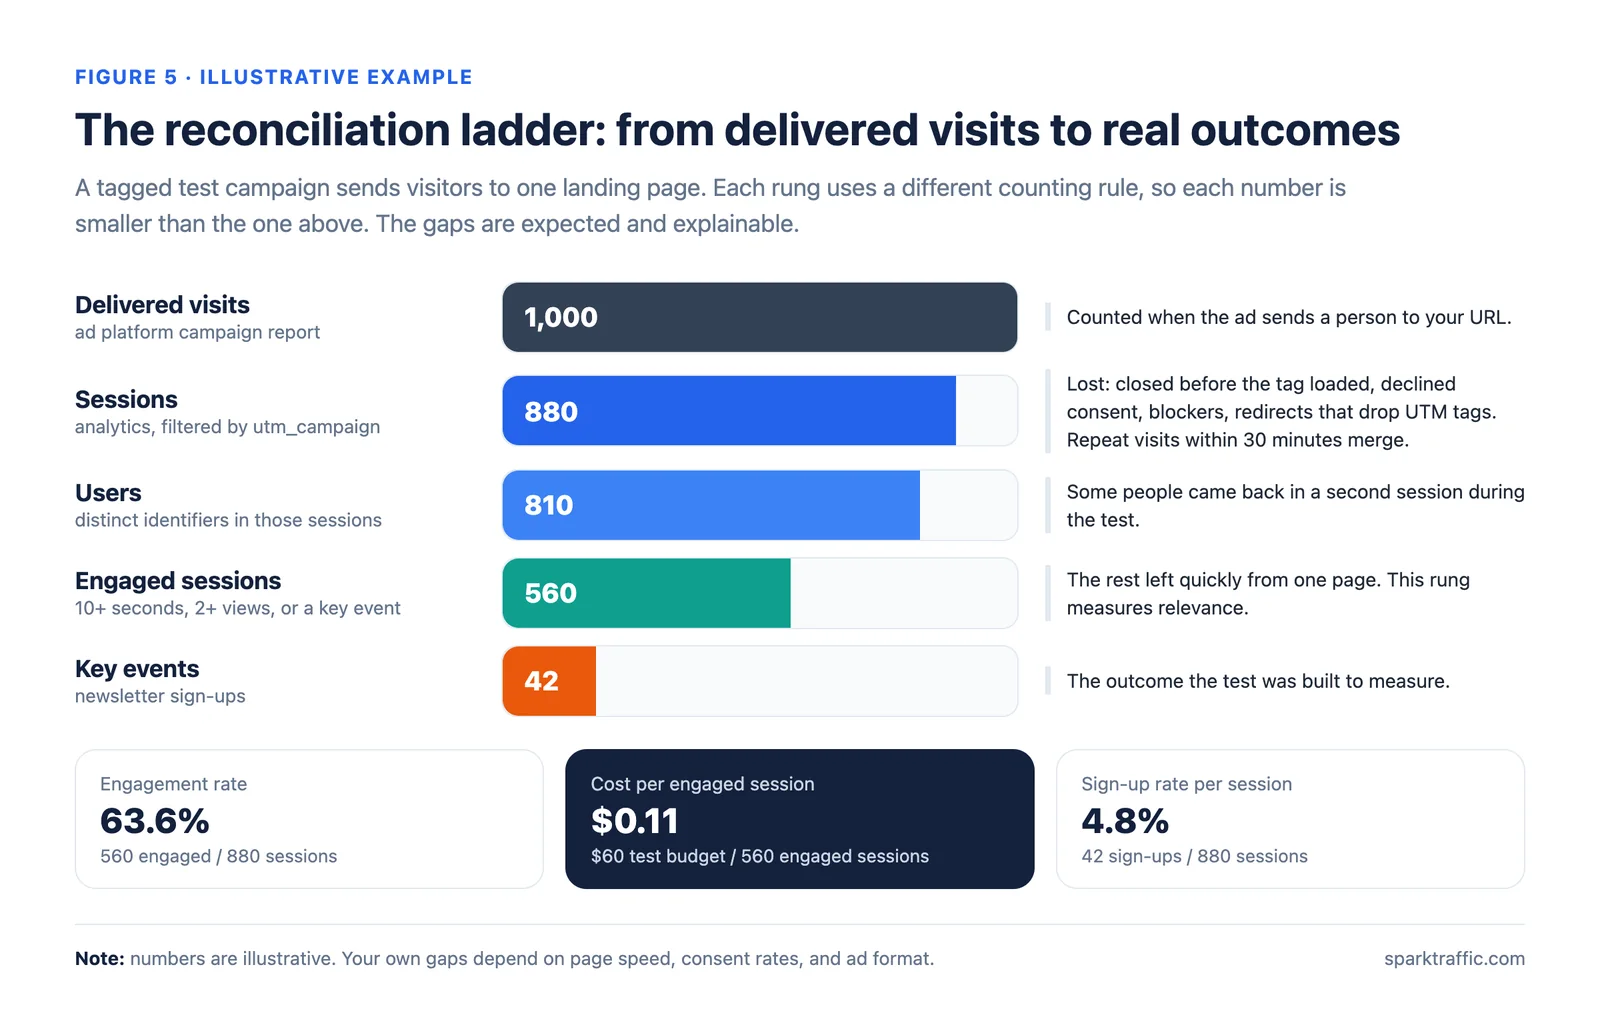
Figure 5. Each rung uses a stricter counting rule, so each number is smaller than the one above. The example numbers are illustrative.
The ladder shows how to read the gap. A small drop from delivered visits to sessions points to healthy tagging. A large drop from sessions to engaged sessions points to a relevance problem with the audience or the landing page. The last rung, key events, tells you whether the test met its goal.
Human visitors also leave a recognizable pattern across the three metrics. Their session lengths vary widely, they arrive at times of day that match their time zones, they use a natural mix of devices and screen sizes, and some of them return for a second session. Automated traffic tends to look uniform: identical session lengths, one view per session, no returns, and no key events. Reading users, sessions, and views together is one of the simplest ways to confirm that a campaign reached real people.
Human visitors also leave a recognizable pattern across the three metrics. Their session lengths vary widely, they arrive at times of day that match their time zones, they use a natural mix of devices and screen sizes, and some of them return for a second session. Automated traffic tends to look uniform: identical session lengths, one view per session, no returns, and no key events. Reading users, sessions, and views together is one of the simplest ways to confirm that a campaign reached real people.
Practical step: UTM tags and cost per engaged session for every campaign
You can tag every campaign URL with UTM parameters using a fixed naming pattern, such as utm_source=platform, utm_medium=display, and utm_campaign=country-offer-month. You then filter GA4 by the campaign name and fill in the ladder: delivered visits, sessions, users, engaged sessions, and key events. Finally, you divide the campaign cost by engaged sessions to get the cost per engaged session.
Cost per engaged session works better than cost per visit because it rewards relevance instead of volume. A campaign that delivers 1,000 visits and 600 engaged sessions is a better investment than one that delivers 2,000 visits and 300 engaged sessions. This metric also keeps paid traffic in its proper role: a way to A/B test landing pages, offers, and new markets with real people, not a way to make numbers look bigger.
Cost per engaged session works better than cost per visit because it rewards relevance instead of volume. A campaign that delivers 1,000 visits and 600 engaged sessions is a better investment than one that delivers 2,000 visits and 300 engaged sessions. This metric also keeps paid traffic in its proper role: a way to A/B test landing pages, offers, and new markets with real people, not a way to make numbers look bigger.
Reporting Honestly: Why Inflated Numbers Backfire
Users, sessions, and page views appear in pitch decks, media kits, and investor updates, so there is steady pressure to make them bigger. The economist Charles Goodhart gave his name to the principle behind this pressure. As Wikipedia summarizes Goodhart's law, "When a measure becomes a target, it ceases to be a good measure." Once page views become a target, people find ways to raise page views that have nothing to do with readers.
Some of these shortcuts are technical, such as splitting one article into many short pages, adding auto-refresh, or firing keep-alive pings. Others are outright fraud. Wikipedia's page view article describes page view fraud, in which bots generate fake views to deceive advertisers. Google's advertising rules treat this seriously: its Enabling dishonest behavior policy prohibits promoting products or services that help users mislead others, including the sale of falsified user activity in the form of invalid clicks.
These tactics are counterproductive even before any policy applies. Inflated counts distort your ratios, hide the pages that real readers value, and make every later decision less accurate. Advertisers and partners compare your claims with their own data, and a media kit that promises 500,000 monthly users but delivers sessions that never convert damages trust quickly. Paid visits also do not raise search rankings, and sending paid visits to pages that display ads can breach ad network rules on invalid traffic.
The human-first principle gives the clearest test. If a number still describes real people making real choices after you explain how it was produced, it is safe to report. If it only looks good until someone asks how it was counted, it is a liability.
Practical step: a measurement note on every external report
Any report that leaves your team, such as a media kit, an investor update, or a client summary, can carry a short measurement note. The note states the tool and property, the date range, which user metric you report (active or total users), the session timeout, whether paid traffic is included and labeled by source, and whether known bot filtering is active.
A measurement note works because it turns a single impressive number into a claim that others can verify. Partners trust figures they can check, and your own team benefits from the same clarity months later, when nobody remembers how an old report was built. Transparency costs a few lines of text and protects the credibility of every number that follows.
A measurement note works because it turns a single impressive number into a claim that others can verify. Partners trust figures they can check, and your own team benefits from the same clarity months later, when nobody remembers how an old report was built. Transparency costs a few lines of text and protects the credibility of every number that follows.
A 20-Minute Weekly Routine for Reading Your Traffic
Knowing the definitions is the easy part. The hard part is reading the three metrics consistently, week after week, without overreacting to noise or missing a real change. Teams that check dashboards at random tend to notice only large spikes, and by then the cause is often weeks old.
A fixed routine solves this, and it fits in 20 minutes:
A fixed routine solves this, and it fits in 20 minutes:
- Minutes 1 to 5: you compare users, sessions, views, and engaged sessions in the trio view with the previous week and the same week last year.
- Minutes 6 to 10: you check views per session, sessions per user, and engagement rate for your top five channels against their baselines.
- Minutes 11 to 15: you investigate any red-flag movement, starting with tracking changes, then source quality, then content.
- Minutes 16 to 20: you write three plain sentences in the "browsers made visits and loaded pages" format and share them with your team.
This routine works because it pairs the numbers with a short written interpretation, and writing forces clarity. Over a quarter, those weekly notes become a record of what really changed for your audience. The routine also fits well with the wider set of analytics habits that improve web traffic. Sessions, users, and page views are only proxies, and a steady routine keeps your attention on the people behind them.
Frequently Asked Questions About Sessions, Users, and Page Views
Can sessions be higher than users?
Yes, and on most websites they are. One user can start several sessions in a date range, for example a morning visit and an evening visit. A sessions-per-user ratio above 1 simply shows that some people came back.
Why are my page views higher than my sessions?
Every session contains at least one page view, and many sessions contain several. Reloads and history changes on single-page applications also add views without adding sessions. A large gap is normal on content sites, while a sudden jump in the gap deserves a tracking check.
Does a page refresh start a new session?
No. A refresh within the session timeout adds one page view to the same session. GA4 starts a new session only after 30 minutes without activity by default, or after the custom timeout you set for your property.
Is a user the same as a unique visitor?
In practice, both terms describe one browser identifier, not one person. Most analytics tools, including GA4, count users through a cookie or an app instance ID. The same person on two devices therefore appears as two users unless you use sign-in data to connect them.
Why does GA4 show fewer sessions than Universal Analytics did?
GA4 does not restart sessions at midnight or when a visitor arrives with new campaign parameters, so it splits fewer visits. GA4 also estimates session counts with the HyperLogLog++ algorithm, which adds a small, stable difference compared with exact counts.
What is a good number of views per session?
There is no universal good number, because the ratio depends on your site type and goals. A documentation site can do well with 1.3 views per session if visitors find their answer fast. Your own 90-day baseline by channel is a more useful benchmark than any industry average.