Nếu có một điều mà mọi chủ sở hữu website đều mong muốn kể từ buổi bình minh của internet, thì đó chính là có thêm nhiều lưu lượng truy cập.
Nhiều lượt truy cập hơn đồng nghĩa với nhiều người mua sắm hơn, đặt dịch vụ hơn, đọc nội dung của bạn hơn và tạo ra doanh thu. Có hàng chục chiến lược khả thi để thu hút nhiều người hơn đến website của bạn, nhưng việc bạn nên tập trung vào chiến lược nào sẽ thay đổi tùy thuộc vào hoàn cảnh của mình.
Một số chủ website có thể muốn đẩy mạnh SEO, trong khi những người khác có thể cần tập trung vào lưu lượng truy cập mục tiêu mà quảng cáo trả phí có thể mang lại, và cũng sẽ có những người muốn tập trung vào việc đảm bảo lượng truy cập họ đã có sẽ tiếp tục quay lại. Câu trả lời “đúng” phụ thuộc vào chính xác vấn đề mà bạn đang đối mặt.
Dưới đây là 9 tình huống phổ biến nhất có thể đang hạn chế lưu lượng truy cập web của bạn và cách khắc phục chúng:
1. Website của bạn còn mới và có rất ít hoặc không có lưu lượng truy cập
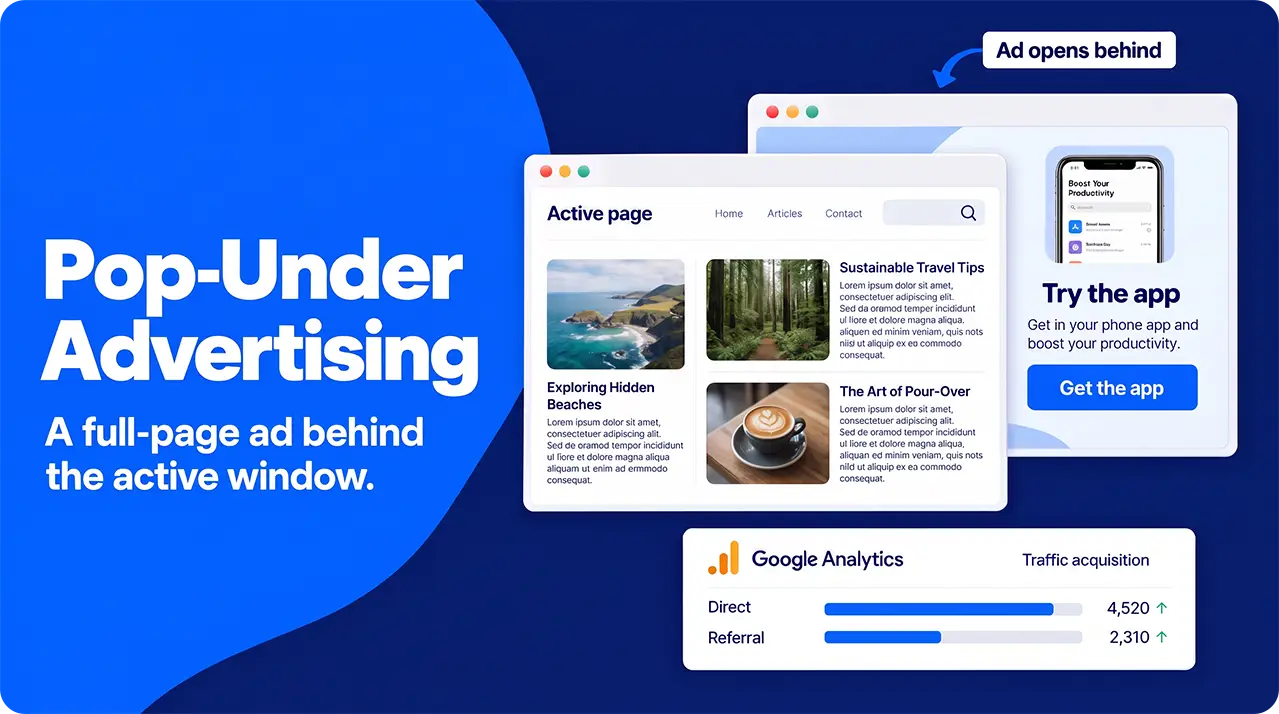
Một trang web mới có thể nhanh chóng thu hút lượng lớn traffic thông qua quảng cáo trả phí, nhưng việc bắt đầu xây dựng một nguồn truy cập bền vững hơn cũng rất quan trọng.
Xác Định Vấn Đề
Đây là vấn đề dễ nhận biết nhất - một website mới khó có thể nhận được nhiều lưu lượng truy cập cho đến khi bạn bắt đầu tiếp thị nó và cho mọi người biết rằng nó tồn tại.
- Quảng cáo tìm kiếm: phù hợp nhất để nhắm mục tiêu theo nhu cầu cấp bách và cho các dịch vụ mà mọi người khó có thể tìm hiểu một cách ngẫu hứng.
- Quảng cáo hiển thị và video: tổng quát hơn. Rất phù hợp để quảng bá một ưu đãi cụ thể, nhắm mục tiêu theo sở thích và xây dựng nhận diện thương hiệu.
- Conversion rate: the percentage of visitors who take the action you want them to take.
- Scroll depth: how far down the page people scroll while reading your content.
- Abandonment rate: the percentage of people who start your desired action (say, filling in a form) and fail to complete it.
- Average order value (AOV): total revenue divided by the number of orders.
- Revenue per visitor: total revenue divided by the number of visitors, including those who bought nothing.
Mặc dù SEO thường được xem là nguồn lưu lượng truy cập tốt nhất cho các website, với việc riêng Google mang lại gần 63% tổng số lượt truy cập, đây không phải là một quá trình nhanh chóng, và với tư cách là chủ sở hữu một website mới, bạn muốn thấy những kết quả có thể đo lường được ngay bây giờ.
. Không giống như tốc độ tăng trưởng chậm mà ổn định đến từ việc viết blog, quảng cáo trả phí có thể, với ngân sách và nhắm mục tiêu phù hợp, mang lại một làn sóng truy cập gần như ngay lập tức.
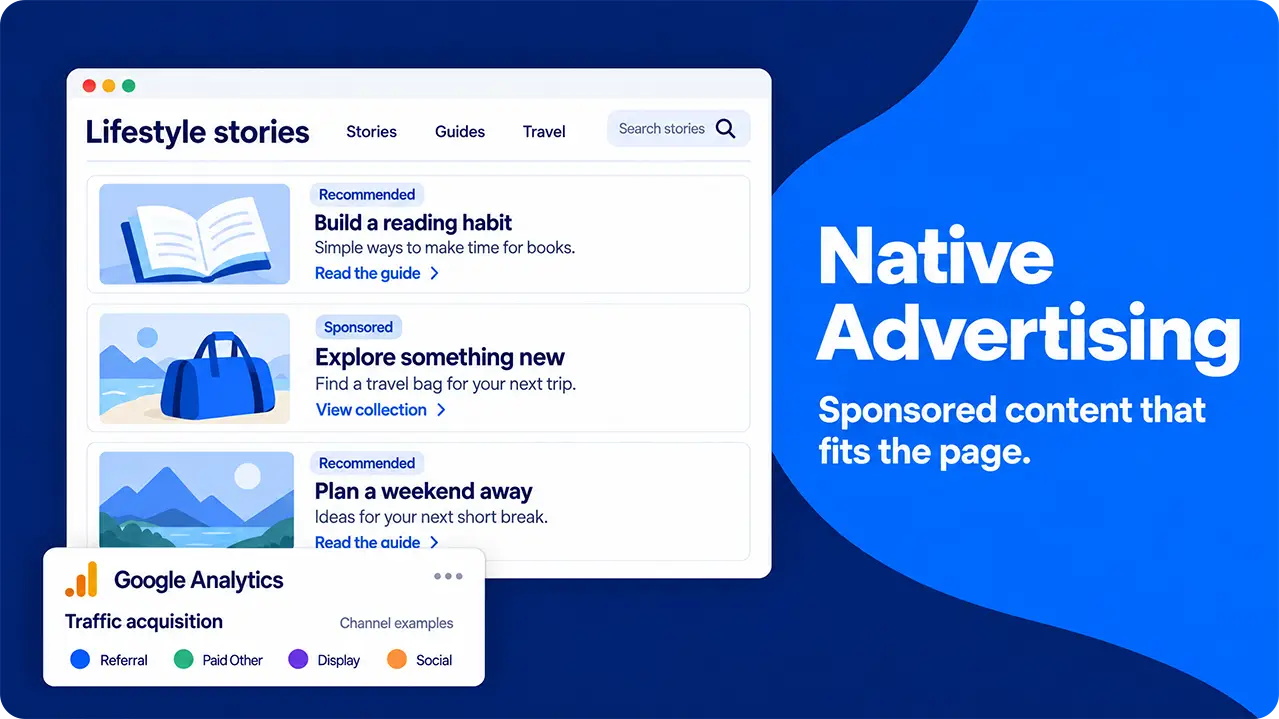
Bạn có thể chạy quảng cáo trên mạng xã hội, trong , hoặc dưới dạng quảng cáo banner truyền thống mà tất cả chúng ta đều nghĩ đến khi nghe cụm từ “quảng cáo trực tuyến”. Những quảng cáo này có thể được tạo và nhắm mục tiêu cực kỳ sát theo nhiều tiêu chí khác nhau, biến gần như bất kỳ ai thành khách truy cập website tiềm năng.
Mỗi loại đều có cách sử dụng lý tưởng riêng:
Cách khắc phục
Một website mới là khoảng thời gian đầy hứng khởi đối với người làm marketing — nó mang đến rất nhiều tiềm năng và cơ hội để thực sự định hướng phát triển. Câu trả lời thẳng thắn (dù đơn giản) cho vấn đề này là ở thời điểm hiện tại, bạn thực sự có thể thử bất cứ điều gì và bắt đầu tạo ra thêm một vài lượt truy cập. Tuy vậy, vẫn có một vài chiến lược hợp lý nhất ở giai đoạn đầu này.
Bạn có thể tiếp cận vấn đề này theo hai cách: một giải pháp dài hạn hoặc một cách khắc phục nhanh hơn.
Bạn có thể tiếp cận vấn đề này theo hai cách: một giải pháp dài hạn hoặc một cách khắc phục nhanh hơn.
The great thing about A/B tests is that they can be used to test almost any element of your landing pages. You might want to focus on the effects of something technical like loading times, or on something as small as how visible your call-to-action button is. The colour itself matters less than contrast. A button that blends into the page is easy to miss whatever its colour, so a test of contrast or size usually tells you more than a test of orange against blue.
The important thing is to only test a single variable with each iteration of the site. This means that you can draw solid conclusions about its impact without muddying the waters with questions over which change caused which result.
The important thing is to only test a single variable with each iteration of the site. This means that you can draw solid conclusions about its impact without muddying the waters with questions over which change caused which result.
2. Trang web có lượng truy cập phù hợp, nhưng cần tiếp cận nhiều người hơn
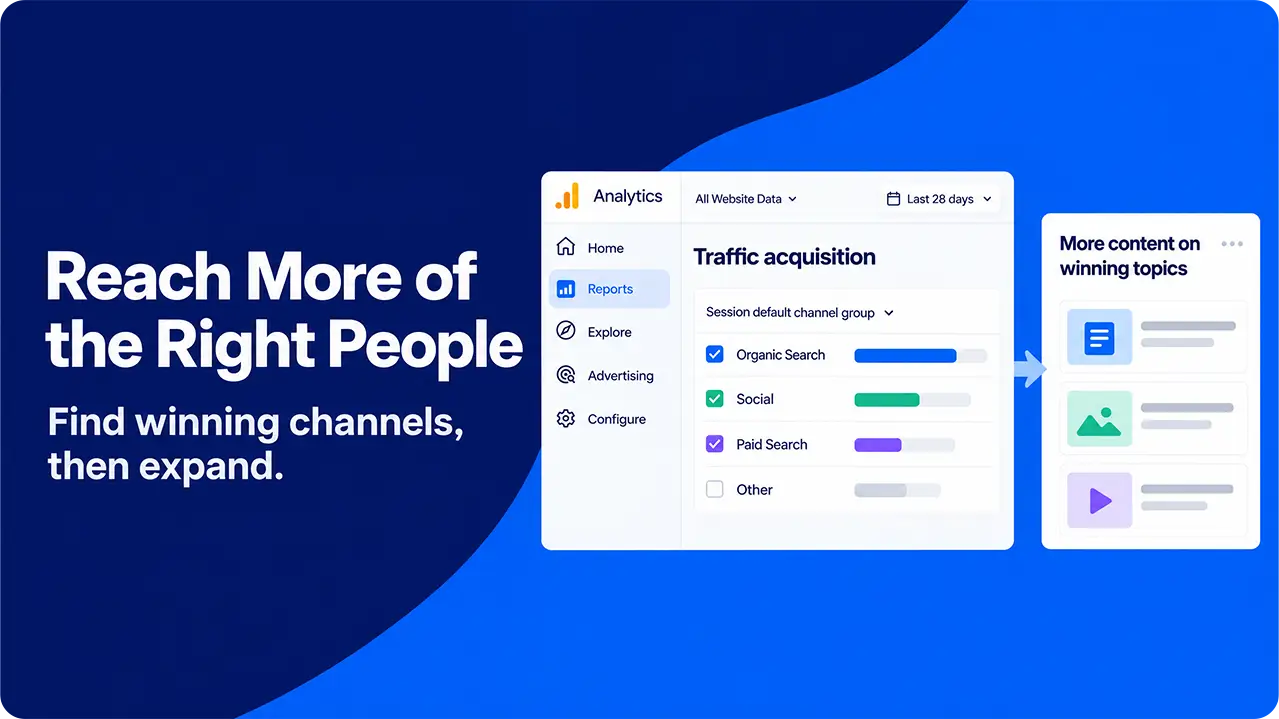
Phân tích là chìa khóa để hiểu điều gì đang tạo ra lưu lượng truy cập cho bạn. Hãy sử dụng chúng để nhân rộng những nỗ lực thành công nhất của bạn và loại bỏ việc phỏng đoán. Bạn cũng có thể sử dụng mạng xã hội và tiếp thị liên kết để mở rộng phạm vi tiếp cận đến các đối tượng phù hợp.
- Time: organic traffic growth tends to be a slow, steady process. Paid traffic can start gathering information almost instantly, allowing a much quicker answer to your hypothesis.
- Control: paid campaigns let you decide how many visitors arrive each day, when the test starts and stops, and how much it costs. You can also keep the targeting identical for the whole test, so the only thing that changes between version A and version B is the page itself. The 50/50 split between versions is something you set up on your own site, as Step 5 explains, because the ad platform alone cannot guarantee it.
- Segmentation: paid advertising lets you choose who sees your ads by location, device and interests. The visitors in your test then resemble the market you want to win, so the result is more relevant to the customers you care about. The result applies to that audience only. A page that wins with mobile visitors in one country may not win with desktop searchers somewhere else.
In short, using paid ads to generate the traffic for your split tests means that you get more relevant results, quicker.
3. Lưu lượng truy cập trang web đã giảm
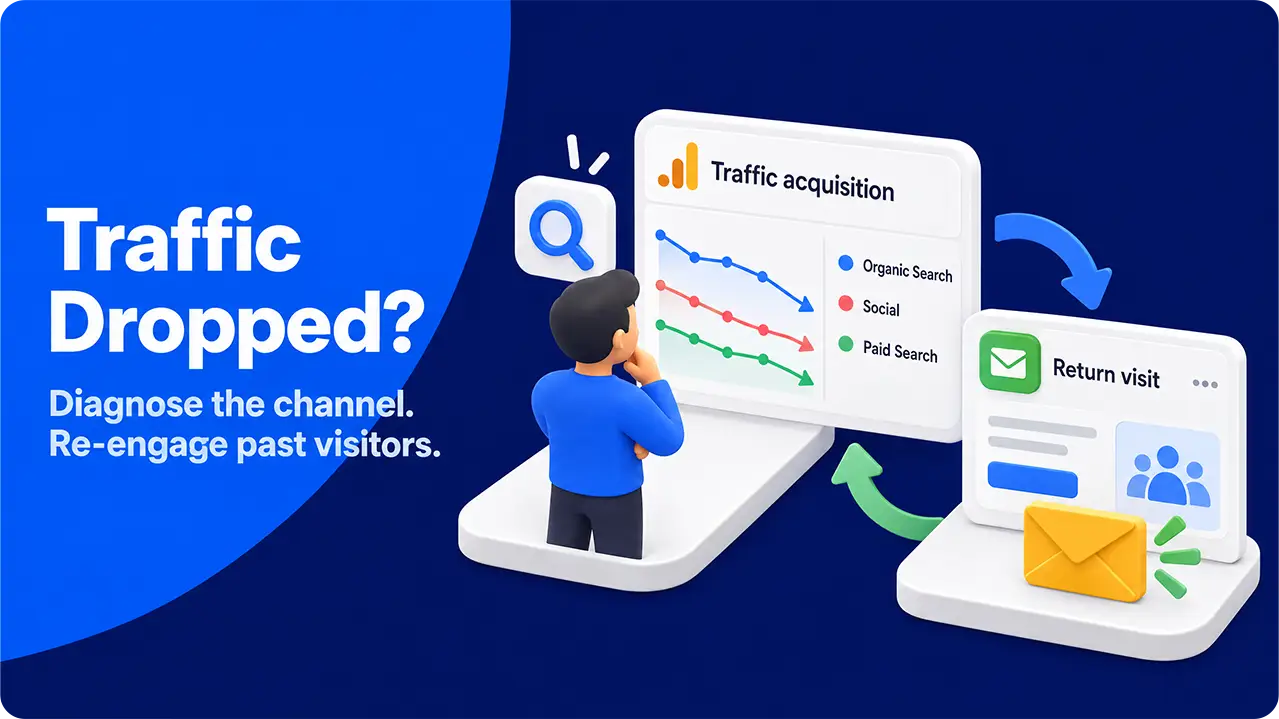
Lưu lượng truy cập có thể thay đổi vì nhiều lý do, vì vậy điều quan trọng là phải đảm bảo rằng chiến lược tiếp thị của bạn đa dạng nhất có thể. Để có kết quả nhanh chóng, hãy cân nhắc tiếp thị lại đến những khách truy cập trước đây thông qua quảng cáo hoặc email.
Xác định vấn đề
Sự sụt giảm lưu lượng truy cập website sẽ hiển thị trên bảng điều khiển phân tích của bạn. Các báo cáo bạn tìm thấy ở đó sẽ cho bạn biết chính xác những luồng nào đã thay đổi và từ đây, bạn có thể bắt đầu ghép nối các dữ kiện để hiểu tại sao chúng lại thay đổi.
Cách khắc phục
Đôi khi, những gì từng hiệu quả dường như không còn tác dụng nữa và lưu lượng truy cập website của bạn sẽ giảm. Có thể có vô số lý do đằng sau điều đó; phổ biến nhất là:
Step 3: Isolate Your Variable
The variable is the change that we’re testing. To ensure that the data we’re collecting is clear and valid, it’s important to only change one element for each test (you can always run another test later to check other theories you may have).
The variable could be almost any element of your landing page, but commonly tested ones include things like:
The variable could be almost any element of your landing page, but commonly tested ones include things like:
- Thay đổi thuật toán: Các công cụ tìm kiếm, mạng xã hội và AI thường xuyên tự cập nhật, làm thay đổi những gì chúng ưu tiên. Nội dung của bạn từng xếp hạng tốt trước đây giờ có thể đã tụt xuống thấp hơn trong danh sách.
- Sự cố theo dõi: Đôi khi, việc cập nhật trang web của bạn có thể gây ra sự cố với phần mềm phân tích. Hãy tự tải trang của bạn lên và xem liệu lượt truy cập của bạn có được ghi nhận hay không.
- Đối thủ cạnh tranh vượt mặt bạn: SEO không đứng yên và nếu bạn đã thành công, rất có thể các đối thủ của bạn đã để ý và bắt đầu sao chép chiến lược của bạn.
- Position of CTA: where the call to action sits on the page
- CTA wording: how the CTA is presented to visitors
- Form size: the number of fields someone has to fill in
- Copy: the text that populates your page
- Loading time: does quicker loading result in more conversions
Of course, you could run an A/B test on any element of your page, though the ones listed above are likely to have the biggest impacts and be the easiest to draw clear conclusions from.
Step 4: Prepare Your Pages
The final step before we can start generating traffic and running the test is to prepare your pages. For most landing-page tests, two versions work best. Each extra version splits your traffic further, so a test with three versions needs at least 50% more visitors in total than a test with two. Comparing several versions at once also raises the chance of a false winner.
You can still run an A/B/n test with three or four versions if your traffic allows it. Either way, each version should differ from the control in one element only. If you want to test several elements together, that is a different method called multivariatetesting.
Your existing page is the “A” part and acts as a control, setting the baseline. The version with the single change is the “B” element and allows you to test your hypothesis.
Step 5: Set Up Your Paid Traffic
Most paid ad platforms have built-in experiment features, but they are built to compare ads and campaigns, not landing pages. In Google Ads, for example, a campaign experiment splits your budget between an original campaign and a trial campaign. That is useful for testing bids or ad copy, but it does not guarantee that your two landing pages receive equal or comparable visitors.
The reason is that ad platforms optimize delivery. When two ads point to two different pages, the platform’s algorithm decides who sees each ad, and it shows each one to the people it predicts will respond. Researchers call this divergentdelivery. A study in the Journal of Marketing found that it can distort the size of an ad test result and even reverse its direction.
The safer setup is to send all paid visitors to one campaign URL and split them on your own site. A testing script or a server-side rule assigns each visitor at random to version A or version B, 50/50. The same rule stores the assignment in a first-party cookie, so a returning visitor always sees the same version. Without this, one person can see both versions, and their behaviour then counts toward both groups and blurs the difference you are trying to measure.
If your setup forces you to use two separate campaigns, give them identical targeting, the same start time and the same daily cap. Before you read any results, compare the device and location mix of the two groups. If one group has far more mobile visitors than the other, the comparison is not fair.
How Much Traffic Should I Buy?
There is no single number of visits that makes a test accurate, because the number depends on four inputs. The first is your baseline conversion rate, which is how often the control page converts today. The second is the smallest lift you want to be able to detect. The third and fourth are the significance level and the statistical power, which most teams set at 95% confidence and 80% power.
Here is how the numbers work out for a page that converts at 4%. To detect a 20% lift (from 4.0% to 4.8%), you need about 10,300 visitors per version. To detect a 10% lift (from 4.0% to 4.4%), you need about 39,500 per version, almost four times as many. A page that converts at 2% needs about 80,700 visitors per version to detect a 10% lift, while a page at 10% needs about 14,800.
Duration does not change these numbers. A test that reaches 10,300 visitors per version in 14 days is as reliable as one that takes 30 days to reach the same total, as long as both cover full weeks. You can turn the sample size into a budget before you start: visitors per version × 2 × cost per visit. At an example cost of $0.50 per visit, the 20% lift test above costs about $10,300.
If that budget is too high, you have two honest options. You can test a bolder change, because larger lifts need far fewer visitors. Or you can choose a primary metric with a higher base rate, such as engagement rate: at around 50%, 1,000 visitors per version can detect a difference of about 6 percentage points. The method behind these numbers is called samplesizedetermination, and free online calculators do the arithmetic for you.
Step 6: Run the test
Before the first visitor arrives, you fix the sample size from the previous step and the duration needed to reach it. We recommend whole weeks (7, 14, 21 or 28 days), so every weekday appears equally in both versions. Then you wait for the test to finish before you decide anything.
The reason is that random noise is largest early in a test. If you check the results every day and stop the first time one version looks significant, your real false-positive rate rises far above the 5% you planned. Statisticians call this optionalstopping, and marketers often call it peeking.
A fixed plan cannot remove chance, but it keeps the risk of a false winner at the level you chose. It also protects your data from short-lived distortions such as:
- Time-of-day and day-of-week patterns
- A few heavy users who visit many times
- One-off events, such as a competitor’s sale or a news story
Selecting a “winner” before the test has run its full course simply because it seems to be doing better in the early stages risks implementing a falsepositive and damaging your results long-term.
What represents a “fair” test will vary from case to case, but the general rule is that you need to run it for long enough and with enough visitors for your results to reach statistical significance. The sample size you calculated before launch tells you what “long enough” and “enough visitors” mean for your test.
What represents a “fair” test will vary from case to case, but the general rule is that you need to run it for long enough and with enough visitors for your results to reach statistical significance. The sample size you calculated before launch tells you what “long enough” and “enough visitors” mean for your test.
Step 7: Evaluate Your Results and Implement the Winner
Once your test has run its full length, you can evaluate the results. This means two things: first, checking to see if your hypothesis was correct and your primary metric was improved by changing your chosen variable, and secondly, looking at your other metrics to check for unintended consequences.
If your primary metric has improved by a statistically significant margin and your guardrail metrics have not worsened, your test has been successful, and you can replace the original page with the new version. If the impact was negative, keep the control and scrap the new iteration. If the difference is not significant either way, the test is inconclusive. The change made no measurable difference at this sample size, and keeping the control is usually the cheaper choice.
If you find that your primary metric has improved but your other important metrics have also been affected, you’ll have to make a judgment call about which version of your landing page is best to use. Weigh up the impacts carefully and consider further testing to refine your page further.
4. Lưu lượng truy cập đang tăng, nhưng website lại thu hút nhầm đối tượng
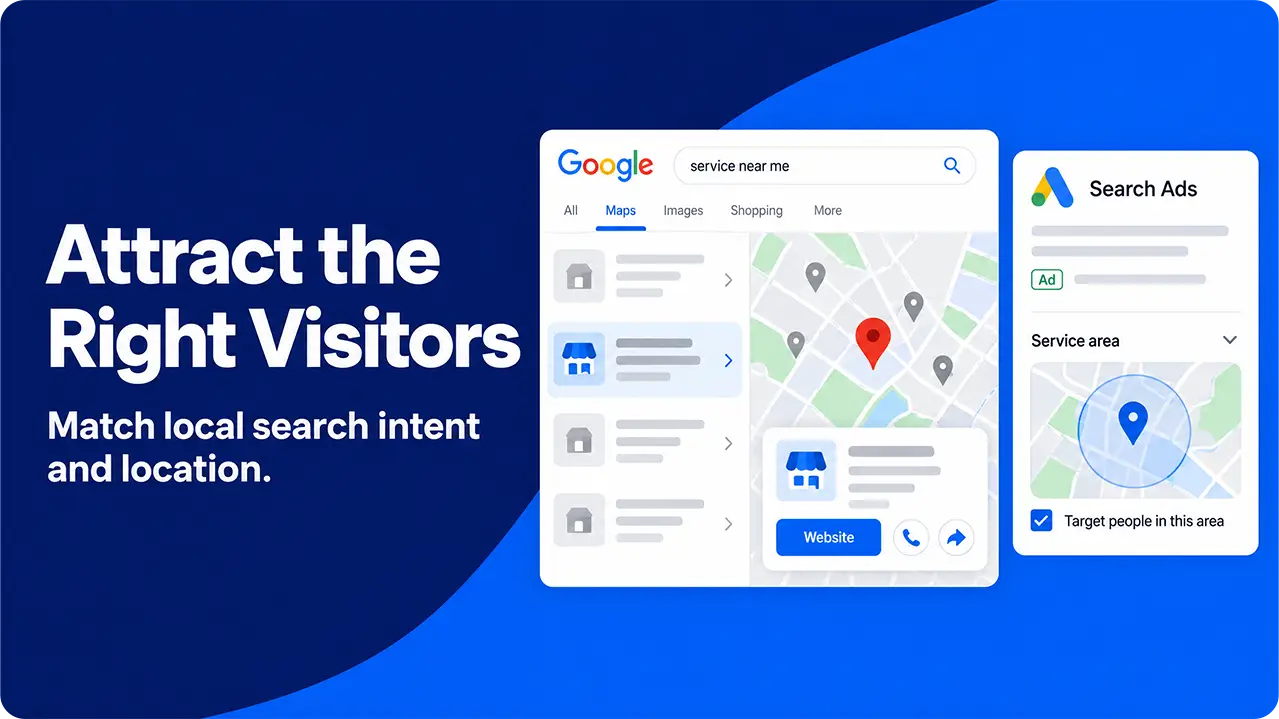
Không phải mọi lưu lượng truy cập đều có giá trị như nhau. Hãy cân nhắc dành thời gian cải thiện SEO địa phương và quảng cáo nhắm mục tiêu, tùy thuộc vào đối tượng tạo nên nguồn lưu lượng truy cập phù hợp nhất với bạn.
Statistical Significance
Nếu số liệu phân tích của bạn cho thấy lượng khách truy cập đang tăng lên nhưng bạn không thấy doanh số và lượt đăng ký tăng tương ứng, thì có thể trang web của bạn đang thu hút không đúng đối tượng. Khi đã nhận ra vấn đề này, bạn có thể bắt đầu phân tích ngược các nỗ lực tiếp thị của mình và nhắm mục tiêu chúng sát hơn đến nguồn lưu lượng truy cập phù hợp.
Sample Size and Duration
While these should have been set right at the start of the testing process, it’s worth checking them again when evaluating your results. There are tools out there that can help you determine what sample sizes and timescales you should be aiming for to reach statistical significance in your results.
Basically, the longer your test runs for and the more people it includes, the more sure you can be of the long-term sustainability of any improvements that you find. There are, of course, limits to this: no marketing team has an unlimited timescale or budget for buying traffic, so it’s important that realistic numbers are set and checked.
While you look at your sample sizes, it is worth checking that each version received the share of visitors you planned. If you set a 50/50 split and see 5,400 visitors on one version and 4,600 on the other, something is wrong with the setup, not with your luck. This problem is called a sampleratiomismatch, and a simple chi-squared test confirms it.
A sample ratio mismatch usually comes from the setup, not from the traffic source. Typical causes include a redirect that loses some visitors, a tracking tag that fails to fire on one version, or bot filtering that removes more visits from one group. If the check fails, the results cannot be trusted, and the fix is to find the cause and rerun the test.
Assessing External Factors
Unfortunately, the internet is not a sterile test environment and external factors will probably creep into your results. While using paid traffic can help to minimize this potential statistical pollution, it can’t totally eliminate it.
These factors could include all kinds of things, from seasonal changes in behaviour (people being more open to e-commerce ads around the holidays) to other marketing campaigns that you may be running. Technical issues, such as one page loading slightly slower than the other, may also have a surprisingly large impact on your results. If no one waits long enough to see your test variable, you can’t really test it.
These factors don’t invalidate your results, but they should be carefully considered before you start applying them.
Audience Segmentation
While you can pull headline figures from your A/B tests such as “5% more sign-ups”, you can also look at how different groups of visitors responded. This is especially useful with paid traffic, because you chose the audience and your analytics records each visitor’s device, location and traffic source.
The tempting approach is to slice the results by every dimension available, such as device, browser, country, age and gender. The problem is that every slice is another chance for luck to produce a false winner. With 10 segments tested at the 5% threshold, the chance that at least one shows a “significant” difference by luck alone is about 40%, a pitfall known as the multiple comparisons problem. Each slice also holds only part of your sample, so its numbers are less reliable.
It also helps to build segments from your own analytics rather than from ad-network profiles. Profiles built from third-party cookies are incomplete, because several major browsers block those cookies by default and consent banners reduce the visits you can measure.
The practical approach is to name one or two segments before the test starts, and device type is the most useful choice for most landing pages. For example, if you planned a mobile versus desktop comparison and desktop visitors convert far more often on version B, you have a solid finding to act on. Any pattern you spot in a segment you did not plan is a hypothesis for your next test, not a result.
Accounting for Outliers
Depending on the metric you have chosen, a few unusual results can distort your data. Revenue is the classic case: a single large purchase on version B can make it look like the winner, even if most of its visitors bought nothing at all.
The simplest fix is capping, also called winsorizing. You choose a cutoff, such as the 99th percentile of order values, and replace every value above it with the cutoff value. For example, if 99% of orders are below $400, a $5,000 order counts as $400. Every visitor stays in the data, including those who spent nothing, so you can still compare average revenue per visitor fairly.
Capping works better than trimming, which deletes the top and bottom values. In revenue data, the bottom values are mostly visitors who spent nothing, so deleting them inflates the average and hides the people who did not buy.
Some analysts use the Mann-WhitneyUtest instead. It pools the results from both pages, ranks them, and checks whether one group tends to produce larger values. It does not need equal group sizes, but it answers a different question from “which page earns more revenue per visitor,” and it struggles when most values are zero. For most landing-page tests, capping and then comparing averages is simpler and closer to the business decision you need to make.
Conclusion: Why You Should Use Paid Traffic For A/B Testing Your Landing Pages
It’s an old truism that there’s always room for improvement, and your landing pages are no exception. While you might be getting great results from your existing pages, you could always be getting more.
A/B testing allows you to try out changes and gather real, solid, statistical information on their impacts before you fully commit. Over the course of a few tests, you can dramatically improve your results without risking mistakes that are hard to reverse.
While you could rely on SEO or some other traffic generation method, using paid ads offers quite a few advantages.
- You can target the people your site is aimed at by location, device and interests from the first day, so the test reflects the audience you want to win.
- You control the volume, timing and targeting of every visit, so both versions are tested on the same audience under the same conditions. A random split on your own site then keeps the comparison fair.
- Your test can begin almost immediately. Once ads are served, traffic starts to flow quickly, so you reach your planned sample size much sooner than you would by waiting for organic traffic.
- Tagging the campaign with UTMparameters lets you analyse only the visitors who came from your test, so organic, direct and returning visitors do not contaminate the results.
- Control over volume, via your ads platform, means that you can stop the test as soon as you reach your desired number of visitors to each page.
When it comes to running accurate, controlled A/B experiments and gaining useful insights into what changes will drive greater conversions, paid traffic is hard to beat.