Si hay algo que todo propietario de un sitio web ha querido desde los albores de internet, es más tráfico.
Más visitas significan más personas comprando, reservando servicios, leyendo tu contenido y generando ingresos. Existen docenas de estrategias viables para atraer a más personas a tu sitio, pero en cuál deberías centrarte cambiará según tus circunstancias.
Algunos propietarios de sitios web podrían querer redoblar esfuerzos en SEO, mientras que otros podrían necesitar centrarse en el tráfico segmentado que puede aportar la publicidad de pago, y otros más querrán centrarse en asegurarse de que el tráfico que ya tienen siga regresando. La respuesta “correcta” depende exactamente del problema al que te enfrentas.
Aquí tienes 9 de las situaciones más comunes que podrían estar limitando tu tráfico web y cómo solucionarlas:
1. El sitio web es nuevo y recibe poco o ningún tráfico
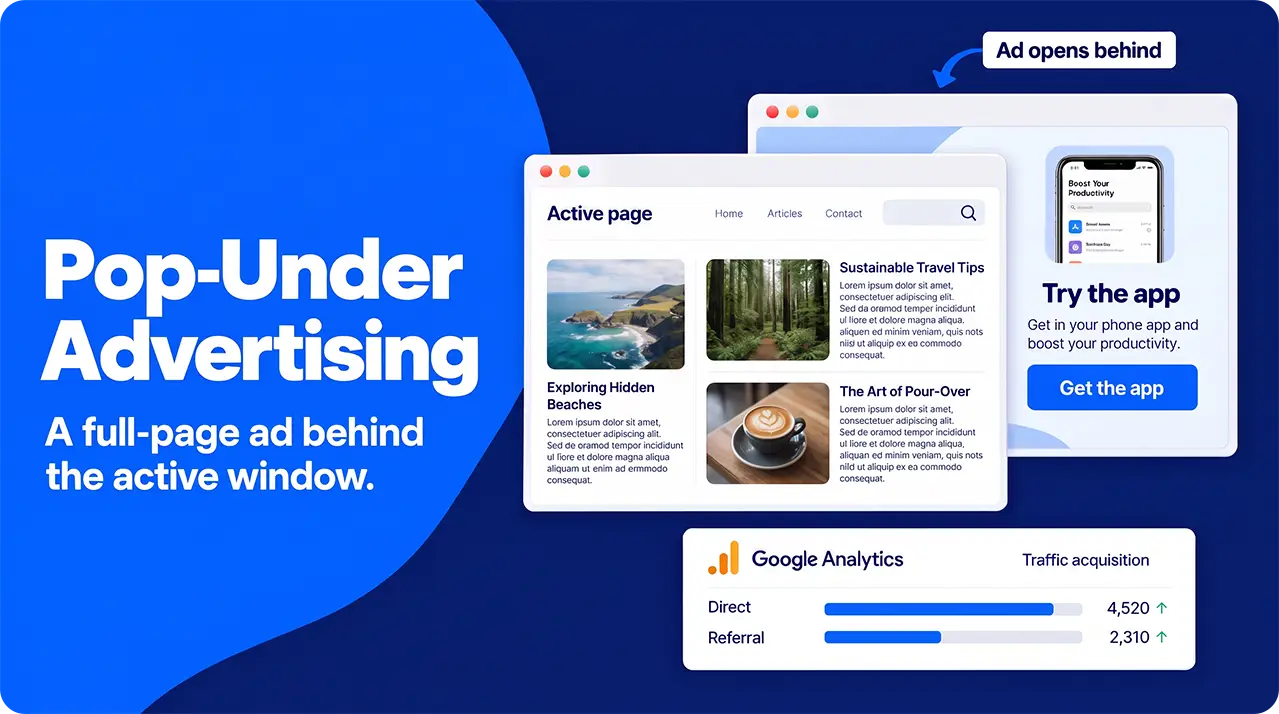
Un sitio web nuevo puede obtener rápidamente una afluencia de tráfico mediante publicidad de pago, pero también es importante comenzar con una fuente de visitas más sostenible.
Identificar el problema
Este es el problema más sencillo de identificar: es poco probable que un sitio web nuevo reciba mucho tráfico hasta que empieces a promocionarlo y a dar a conocer su existencia.
- Anuncios de búsqueda: ideales para dirigirse a quienes tienen urgencia y para servicios que es poco probable que la gente explore por impulso.
- Anuncios display y videos: más generales. Ideales para dar a conocer una oferta en particular, dirigirse a intereses específicos y aumentar el reconocimiento de marca.
- Conversion rate: the percentage of visitors who take the action you want them to take.
- Scroll depth: how far down the page people scroll while reading your content.
- Abandonment rate: the percentage of people who start your desired action (say, filling in a form) and fail to complete it.
- Average order value (AOV): total revenue divided by the number of orders.
- Revenue per visitor: total revenue divided by the number of visitors, including those who bought nothing.
Aunque el SEO suele considerarse la mejor fuente de tráfico para los sitios web, ya que solo Google genera casi el 63% de todas las visitas, no es un proceso rápido, y como nuevo propietario de un sitio web, quieres resultados medibles ahora.
. A diferencia del ritmo de crecimiento lento y constante que proviene del blogging, los anuncios de pago pueden, con el presupuesto y la segmentación adecuados, generar una oleada de visitas casi instantánea.
Puedes publicar anuncios en redes sociales, en los o como los anuncios de banner tradicionales en los que todos pensamos cuando escuchamos la frase “publicidad online”. Estos pueden diseñarse y segmentarse con una precisión increíble según todo tipo de criterios, convirtiendo a casi cualquier persona en un visitante potencial del sitio web.
Cada uno tiene su uso ideal:
Cómo solucionarlo
Un sitio web nuevo es un momento emocionante para un marketero: trae mucho potencial y la oportunidad de realmente marcar el rumbo. La respuesta honesta (aunque simple) a este problema es que, en este punto, realmente podrías probar cualquier cosa y empezar a generar algunas visitas más. Dicho esto, hay un par de estrategias que tienen más sentido en esta etapa temprana.
Puedes abordar este problema de dos maneras: una solución a largo plazo o una solución más rápida.
Puedes abordar este problema de dos maneras: una solución a largo plazo o una solución más rápida.
The great thing about A/B tests is that they can be used to test almost any element of your landing pages. You might want to focus on the effects of something technical like loading times, or on something as small as how visible your call-to-action button is. The colour itself matters less than contrast. A button that blends into the page is easy to miss whatever its colour, so a test of contrast or size usually tells you more than a test of orange against blue.
The important thing is to only test a single variable with each iteration of the site. This means that you can draw solid conclusions about its impact without muddying the waters with questions over which change caused which result.
The important thing is to only test a single variable with each iteration of the site. This means that you can draw solid conclusions about its impact without muddying the waters with questions over which change caused which result.
2. El sitio web recibe tráfico relevante, pero necesita llegar a más personas
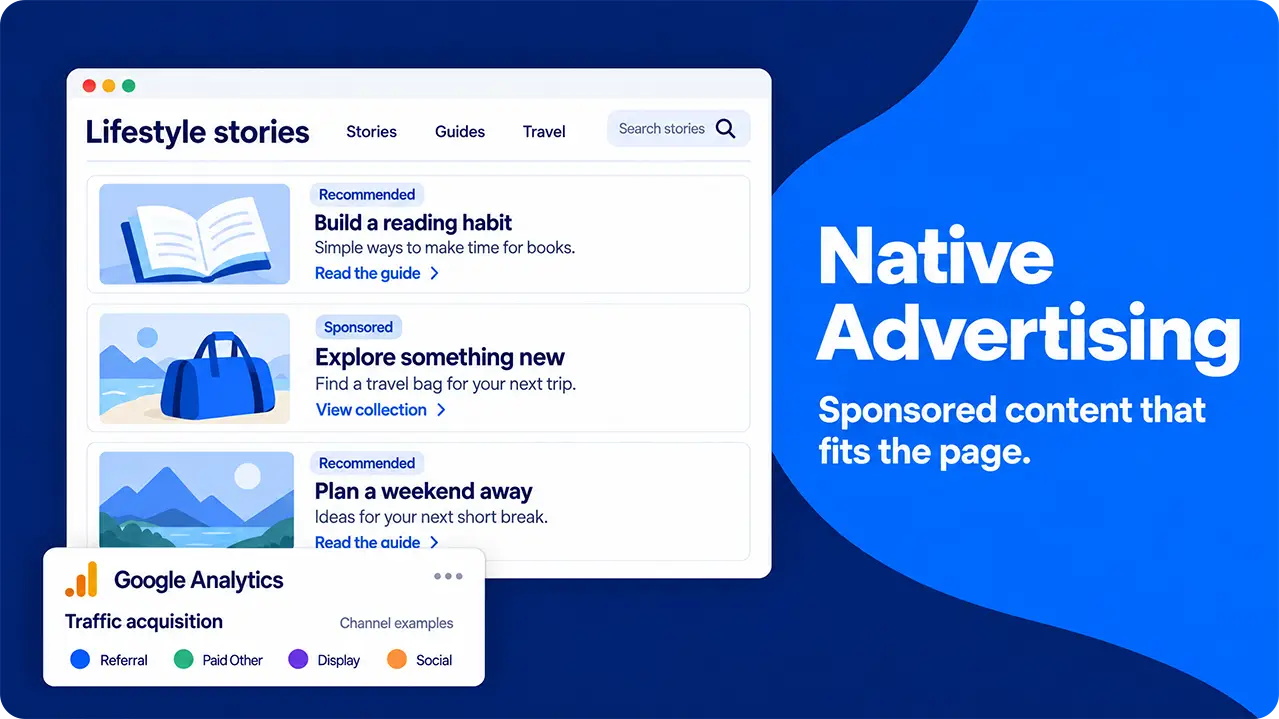
Las analíticas son la clave para entender qué está generando tu tráfico. Úsalas para replicar tus esfuerzos más exitosos y eliminar las conjeturas. También puedes usar las redes sociales y el marketing de afiliación para ampliar tu alcance entre audiencias relevantes.
- Reduce la ceguera ante los banners: las personas están tan bombardeadas con anuncios tradicionales que generalmente filtran la mayoría de ellos. La publicidad nativa no parece un anuncio y generalmente ofrece un poco más de profundidad que simplemente gritar "compra ahora", lo que la hace ideal para lograr una interacción real.
- Evita molestar a los clientes potenciales: los banners y otras formas "intrusivas" de publicidad digital interrumpen la navegación de las personas. La publicidad nativa busca convertirse en parte de su navegación.
- Alta interacción y clics: al parecer una pieza de contenido más, la publicidad nativa ofrece tasas de interacción mucho mejores que algo como un anuncio de display y puede generar una mejor tasa de clics que muchos otros tipos de anuncios pagados.
In short, using paid ads to generate the traffic for your split tests means that you get more relevant results, quicker.
3. El tráfico del sitio web ha disminuido
Los cambios en los flujos de tráfico pueden ocurrir por muchas razones, por lo que es importante asegurarse de que tu combinación de marketing sea lo más variada posible. Para obtener resultados rápidos, considera volver a dirigirte a visitantes anteriores mediante anuncios o correos electrónicos.
Identificar el problema
Una caída en el tráfico web aparecerá en tu panel de análisis. Los informes que encuentres allí deberían permitirte saber exactamente qué flujos han cambiado y, a partir de ahí, puedes empezar a reconstruir por qué han cambiado.
Cómo solucionarlo
A veces, lo que ha estado funcionando parece dejar de hacerlo, y el tráfico de tu sitio web caerá. Podría haber innumerables razones detrás de ello; las más comunes son:
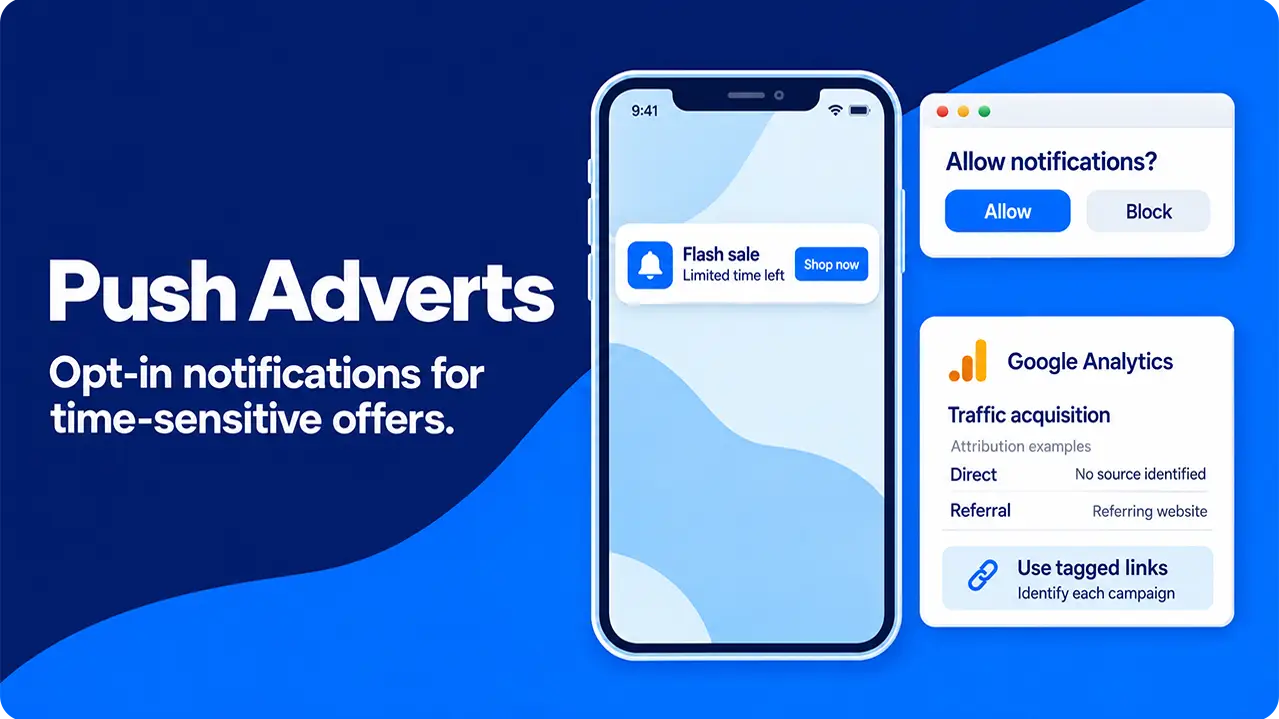
¿Cómo aparecen los anuncios push en tus analíticas y cómo debes monitorizar su éxito?
Google Analytics 4 puede realizar un seguimiento de los anuncios push de diversas formas, dependiendo de cómo estén configurados.
Lo ideal es que tus anuncios push enlacen a una URL "etiquetada" que te permita monitorizar exactamente qué anuncios obtuvieron las respuestas que buscabas. Sin esta información adicional en la URL, es probable que aparezcan como tráfico "referido" o "directo", junto con todos aquellos que escribieron manualmente tu dirección web o hicieron clic en un enlace hacia tu página.
Aunque no sea tan preciso como un anuncio push correctamente etiquetado, puedes hacerte una buena idea del éxito de un anuncio específico comparando tus cifras de tráfico con el momento en que enviaste la notificación. Como la respuesta suele ser rápida, un aumento repentino que coincida con la llegada de tu anuncio a los teléfonos sugiere que ha tenido el efecto deseado.
En cuanto a medir el éxito de un anuncio push concreto, existen algunas métricas a examinar, las cuales, al ser un sistema basado en listas, comparten mucho terreno con el email marketing:
- Cambios en los algoritmos: Los motores de búsqueda, las redes sociales y las IA se actualizan con regularidad, cambiando lo que priorizan. Es posible que tu contenido, que antes se posicionaba bien, ahora aparezca más abajo en los resultados.
- Problemas de seguimiento: Ocasionalmente, actualizar tu sitio web podría causar problemas con tu software de analítica. Carga tu página tú mismo y comprueba si tu visita queda registrada.
- Competidores superándote en el ranking: el SEO no se detiene y, si has tenido éxito, es probable que tus competidores se hayan dado cuenta y hayan empezado a copiar tu estrategia.
- Position of CTA: where the call to action sits on the page
- CTA wording: how the CTA is presented to visitors
- Form size: the number of fields someone has to fill in
- Copy: the text that populates your page
- Loading time: does quicker loading result in more conversions
Of course, you could run an A/B test on any element of your page, though the ones listed above are likely to have the biggest impacts and be the easiest to draw clear conclusions from.
Cómo configurar una campaña de publicidad push
Configurar una campaña de publicidad push es sumamente sencillo. Dado que son ideales para mensajes urgentes, la mayoría de las plataformas utilizan un modelo de autoservicio que te da acceso a las herramientas necesarias para enviar tus notificaciones y te otorga un control total.
Puedes segmentar por ubicación geográfica, tipo de dispositivo y sistema operativo, tiempo de suscripción, nivel de actividad en tu sitio y filtrar por la frecuencia con la que han recibido impactos recientemente (un consejo: no satures los teléfonos de la gente con notificaciones, simplemente se darán de baja y te evitarán en el futuro).
Finalmente, crea tu notificación. Por lo general, dispones de un titular corto, una línea de texto y una imagen para captar la atención. Enfócate en la urgencia con frases como "se acaba el tiempo: aprovecha las ofertas ahora" o mensajes similares.
Dependiendo de la plataforma que utilices y de tus objetivos, puedes elegir entre varios modelos de pago:
Errores comunes en los anuncios push
Existen tres errores comunes en los anuncios push que restan eficacia a las campañas: no segmentar a la audiencia, enviar notificaciones con demasiada frecuencia y utilizar textos e imágenes de baja calidad.
En primer lugar, la segmentación de la audiencia es fundamental. Un mensaje genérico de "visítanos ahora" enviado a toda tu lista de suscriptores difícilmente convencerá a nadie. En su lugar, segmenta a tu audiencia basándote en los datos que posees. La forma más sencilla es hacerlo según el tiempo que llevan suscritos o la última vez que interactuaron con tu sitio. Esto te permite enviar mensajes de bienvenida a los nuevos suscriptores para animarlos a volver, o realizar retargeting a clientes que no han visitado tu web recientemente.
En segundo lugar, aunque la gente vive pegada a sus teléfonos, las notificaciones provocan diversas respuestas, desde picos de dopamina hasta ansiedad. Dirigirse al mismo grupo repetidamente en un corto periodo de tiempo probablemente generará una respuesta negativa, lo que provocará que bloqueen tus futuras notificaciones.
Por último, al disponer de pocas palabras y una sola imagen para transmitir tu mensaje, es vital que cada elemento cumpla su función. Es un dicho común entre los redactores publicitarios que el contenido breve es más difícil de escribir que el extenso precisamente por esta razón. Una llamada a la acción demasiado genérica difícilmente obtendrá respuesta, pero ser demasiado específico podría excluir a una gran parte de tu alcance potencial.
How Much Traffic Should I Buy?
There is no single number of visits that makes a test accurate, because the number depends on four inputs. The first is your baseline conversion rate, which is how often the control page converts today. The second is the smallest lift you want to be able to detect. The third and fourth are the significance level and the statistical power, which most teams set at 95% confidence and 80% power.
Here is how the numbers work out for a page that converts at 4%. To detect a 20% lift (from 4.0% to 4.8%), you need about 10,300 visitors per version. To detect a 10% lift (from 4.0% to 4.4%), you need about 39,500 per version, almost four times as many. A page that converts at 2% needs about 80,700 visitors per version to detect a 10% lift, while a page at 10% needs about 14,800.
Duration does not change these numbers. A test that reaches 10,300 visitors per version in 14 days is as reliable as one that takes 30 days to reach the same total, as long as both cover full weeks. You can turn the sample size into a budget before you start: visitors per version × 2 × cost per visit. At an example cost of $0.50 per visit, the 20% lift test above costs about $10,300.
If that budget is too high, you have two honest options. You can test a bolder change, because larger lifts need far fewer visitors. Or you can choose a primary metric with a higher base rate, such as engagement rate: at around 50%, 1,000 visitors per version can detect a difference of about 6 percentage points. The method behind these numbers is called samplesizedetermination, and free online calculators do the arithmetic for you.
Step 6: Run the test
Before the first visitor arrives, you fix the sample size from the previous step and the duration needed to reach it. We recommend whole weeks (7, 14, 21 or 28 days), so every weekday appears equally in both versions. Then you wait for the test to finish before you decide anything.
The reason is that random noise is largest early in a test. If you check the results every day and stop the first time one version looks significant, your real false-positive rate rises far above the 5% you planned. Statisticians call this optionalstopping, and marketers often call it peeking.
A fixed plan cannot remove chance, but it keeps the risk of a false winner at the level you chose. It also protects your data from short-lived distortions such as:
- Coste por clic: Con el modelo de pago por clic, abonas cada clic que recibe tu notificación. Es ideal para campañas dirigidas a un gran número de destinatarios, ya que solo pagas por las notificaciones que obtuvieron respuesta.
- Coste por mil impresiones: Pagas por un número determinado de entregas. Es ideal si tienes un presupuesto ajustado, ya que no habrá sorpresas desagradables.
- Coste por acción: Solo pagas por las notificaciones que generan una acción específica (normalmente una venta o un registro). Esto puede ofrecer el mejor retorno de inversión (ROI), pero proporciona datos limitados sobre las notificaciones que no tuvieron éxito.
Selecting a “winner” before the test has run its full course simply because it seems to be doing better in the early stages risks implementing a falsepositive and damaging your results long-term.
What represents a “fair” test will vary from case to case, but the general rule is that you need to run it for long enough and with enough visitors for your results to reach statistical significance. The sample size you calculated before launch tells you what “long enough” and “enough visitors” mean for your test.
What represents a “fair” test will vary from case to case, but the general rule is that you need to run it for long enough and with enough visitors for your results to reach statistical significance. The sample size you calculated before launch tells you what “long enough” and “enough visitors” mean for your test.
Step 7: Evaluate Your Results and Implement the Winner
Once your test has run its full length, you can evaluate the results. This means two things: first, checking to see if your hypothesis was correct and your primary metric was improved by changing your chosen variable, and secondly, looking at your other metrics to check for unintended consequences.
If your primary metric has improved by a statistically significant margin and your guardrail metrics have not worsened, your test has been successful, and you can replace the original page with the new version. If the impact was negative, keep the control and scrap the new iteration. If the difference is not significant either way, the test is inconclusive. The change made no measurable difference at this sample size, and keeping the control is usually the cheaper choice.
If you find that your primary metric has improved but your other important metrics have also been affected, you’ll have to make a judgment call about which version of your landing page is best to use. Weigh up the impacts carefully and consider further testing to refine your page further.
4. El tráfico está creciendo, pero el sitio web atrae a las personas equivocadas
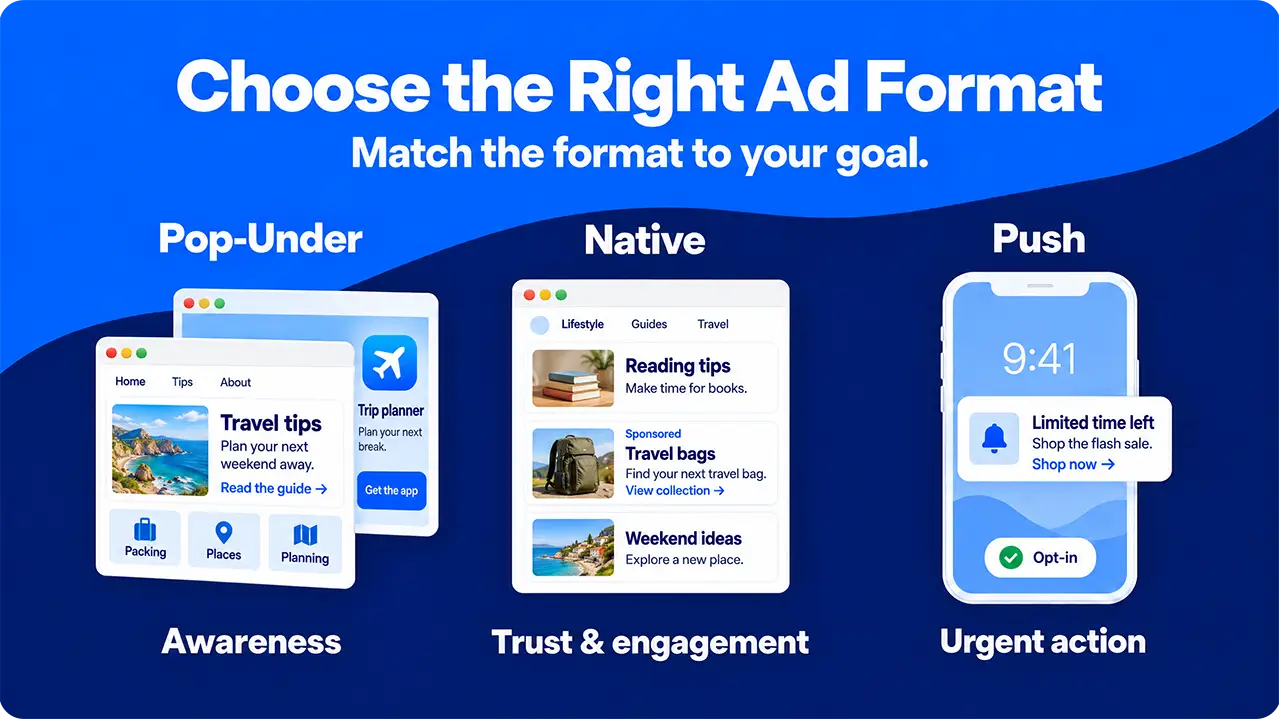
No todo el tráfico vale lo mismo. Considera dedicar tiempo a trabajar en tu SEO local y en anuncios segmentados, según quién componga tu tráfico más relevante.
Statistical Significance
Si tus analíticas muestran un número creciente de visitantes, pero no ves un aumento correspondiente en las ventas y los registros, es posible que tu sitio esté atrayendo al público equivocado. Una vez que hayas detectado este problema, puedes empezar a replantear tus esfuerzos de marketing y orientarlos con mayor precisión hacia tráfico relevante.
Sample Size and Duration
While these should have been set right at the start of the testing process, it’s worth checking them again when evaluating your results. There are tools out there that can help you determine what sample sizes and timescales you should be aiming for to reach statistical significance in your results.
Basically, the longer your test runs for and the more people it includes, the more sure you can be of the long-term sustainability of any improvements that you find. There are, of course, limits to this: no marketing team has an unlimited timescale or budget for buying traffic, so it’s important that realistic numbers are set and checked.
While you look at your sample sizes, it is worth checking that each version received the share of visitors you planned. If you set a 50/50 split and see 5,400 visitors on one version and 4,600 on the other, something is wrong with the setup, not with your luck. This problem is called a sampleratiomismatch, and a simple chi-squared test confirms it.
A sample ratio mismatch usually comes from the setup, not from the traffic source. Typical causes include a redirect that loses some visitors, a tracking tag that fails to fire on one version, or bot filtering that removes more visits from one group. If the check fails, the results cannot be trusted, and the fix is to find the cause and rerun the test.
Assessing External Factors
Unfortunately, the internet is not a sterile test environment and external factors will probably creep into your results. While using paid traffic can help to minimize this potential statistical pollution, it can’t totally eliminate it.
These factors could include all kinds of things, from seasonal changes in behaviour (people being more open to e-commerce ads around the holidays) to other marketing campaigns that you may be running. Technical issues, such as one page loading slightly slower than the other, may also have a surprisingly large impact on your results. If no one waits long enough to see your test variable, you can’t really test it.
These factors don’t invalidate your results, but they should be carefully considered before you start applying them.
Audience Segmentation
While you can pull headline figures from your A/B tests such as “5% more sign-ups”, you can also look at how different groups of visitors responded. This is especially useful with paid traffic, because you chose the audience and your analytics records each visitor’s device, location and traffic source.
The tempting approach is to slice the results by every dimension available, such as device, browser, country, age and gender. The problem is that every slice is another chance for luck to produce a false winner. With 10 segments tested at the 5% threshold, the chance that at least one shows a “significant” difference by luck alone is about 40%, a pitfall known as the multiple comparisons problem. Each slice also holds only part of your sample, so its numbers are less reliable.
It also helps to build segments from your own analytics rather than from ad-network profiles. Profiles built from third-party cookies are incomplete, because several major browsers block those cookies by default and consent banners reduce the visits you can measure.
The practical approach is to name one or two segments before the test starts, and device type is the most useful choice for most landing pages. For example, if you planned a mobile versus desktop comparison and desktop visitors convert far more often on version B, you have a solid finding to act on. Any pattern you spot in a segment you did not plan is a hypothesis for your next test, not a result.
Accounting for Outliers
Depending on the metric you have chosen, a few unusual results can distort your data. Revenue is the classic case: a single large purchase on version B can make it look like the winner, even if most of its visitors bought nothing at all.
The simplest fix is capping, also called winsorizing. You choose a cutoff, such as the 99th percentile of order values, and replace every value above it with the cutoff value. For example, if 99% of orders are below $400, a $5,000 order counts as $400. Every visitor stays in the data, including those who spent nothing, so you can still compare average revenue per visitor fairly.
Capping works better than trimming, which deletes the top and bottom values. In revenue data, the bottom values are mostly visitors who spent nothing, so deleting them inflates the average and hides the people who did not buy.
Some analysts use the Mann-WhitneyUtest instead. It pools the results from both pages, ranks them, and checks whether one group tends to produce larger values. It does not need equal group sizes, but it answers a different question from “which page earns more revenue per visitor,” and it struggles when most values are zero. For most landing-page tests, capping and then comparing averages is simpler and closer to the business decision you need to make.
Conclusion: Why You Should Use Paid Traffic For A/B Testing Your Landing Pages
It’s an old truism that there’s always room for improvement, and your landing pages are no exception. While you might be getting great results from your existing pages, you could always be getting more.
A/B testing allows you to try out changes and gather real, solid, statistical information on their impacts before you fully commit. Over the course of a few tests, you can dramatically improve your results without risking mistakes that are hard to reverse.
While you could rely on SEO or some other traffic generation method, using paid ads offers quite a few advantages.
- You can target the people your site is aimed at by location, device and interests from the first day, so the test reflects the audience you want to win.
- You control the volume, timing and targeting of every visit, so both versions are tested on the same audience under the same conditions. A random split on your own site then keeps the comparison fair.
- Your test can begin almost immediately. Once ads are served, traffic starts to flow quickly, so you reach your planned sample size much sooner than you would by waiting for organic traffic.
- Tagging the campaign with UTMparameters lets you analyse only the visitors who came from your test, so organic, direct and returning visitors do not contaminate the results.
- Control over volume, via your ads platform, means that you can stop the test as soon as you reach your desired number of visitors to each page.
When it comes to running accurate, controlled A/B experiments and gaining useful insights into what changes will drive greater conversions, paid traffic is hard to beat.