
От $0.07–$0.16 за 1 000 посещений


Is your Google traffic growing, dropping or stale? Enter a domain and the free report answers on this page in seconds. It shows monthly visits from Google, the reason behind every change and the keywords to fix first. You do not need an account, an email or a card. All numbers are estimates built from keyword rankings and search volumes, not the site's own analytics.
No sign-up. Results in seconds.



Google visits fell 45% in 6 months, from 26,992 a month in May 2026 to 14,887 today.
That is the gap since May 2026, worth about $34,200 a month in Google Ads. SparkTraffic rebuilds the pages that slipped with niche backlinks and keeps leads coming with geo-targeted visitors while rankings recover.
Google visits grew from 10,281 to 39,504 a month by January 2026, then fell 62% to 14,887 today. The biggest steps down followed the March 2026 core update and the August and September 2026 spam updates.
Visits fell from 20,596 in August to 13,357 in October 2026, after the August 18 and September 24 spam updates. A link audit shows which links and pages can send spam signals.
buy backlinks fell from position 1 to 4, and free website traffic from 1 to 2. Position 1 gets the largest share of clicks, so a small drop costs many visits.
website traffic checker has 19,000 searches a month but brings 668 visits. It shows as a new ranking, which often happens after a URL change or a redirect.
Your Google traffic is 14,887 visits a month, down from 26,992 in May. The plan covers the 3 keywords you selected: links for the pages that lost position 1, a title test for website traffic checker, and geo-targeted visitors to keep leads coming while rankings recover.
Most traffic checkers show one number. A number does not tell you what to do next. This checker reads 24 months of Google traffic, matches every change with Google's update dates and shows the keywords to fix first.
A clear verdict based on Google visits this month compared with 6 months earlier. Up more than 10% is growing, down more than 10% is dropping, anything in between is stale.
Each jump or drop is matched with Google's core and spam update dates, and with the keywords that moved up, moved down or started ranking.
Near-win keywords in positions 4 to 10 and the pages that lost position 1. These keywords already have demand, so they are the fastest visits to win back.
Every report ends with a free plan for the state your site is in. The plan uses the keywords and pages from your report, and you start with 2,000 free credits.
Your visits fell more than 10% in 6 months. The plan wins back the pages that slipped and keeps leads coming meanwhile.
Your visits moved less than 10% in 6 months. The plan moves near-win keywords into the top 3, where most clicks are.
Your visits grew more than 10% in 6 months. The plan secures the pages that grew before the next Google update.
Введите домен в инструмент проверки вверху этой страницы и выберите «Проверить трафик». Отчёт откроется за несколько секунд — без регистрации.
Инструмент находит ключевые слова, по которым сайт ранжируется в Google, берёт месячный объём поиска для каждого и применяет долю кликов, которую обычно получает его позиция. Сумма даёт оценку ежемесячного поискового трафика сайта. Страница на позиции 1 получает во много раз больше кликов, чем страница на позиции 8 по тому же ключевому слову, поэтому позиции важнее количества ключевых слов.
Считайте результат ориентиром, а не точным числом. Он наиболее полезен для сравнения конкурентов и отслеживания тенденций.
Запустите одинаковую проверку для своего сайта и двух-трёх конкурентов. Затем сравните четыре показателя: ежемесячные переходы из Google, ключевые слова в топ-3, ведущие страны и динамику за 2 года.
Сравнение показывает, в чём выигрывает конкурент. Если он получает вдвое больше переходов при вдвое меньшем числе ключевых слов, он выше ранжируется по меньшему числу, но более ценным запросам. Если его динамика растёт, а ваша остаётся ровной, посмотрите, что он публиковал в месяцы роста линии.
Инструмент начинает с домена, а не с ключевого слова. Введите сайт, и в отчёте будут перечислены его главные небрендовые ключевые слова с позицией, ежемесячным объёмом поиска, оценочным трафиком и сложностью ключевого слова (KD — оценка от 0 до 100 того, насколько трудно ранжироваться по запросу).
Сначала смотрите на столбец трафика, а не объёма. Ключевое слово с 5 000 запросов на позиции 2 часто приносит больше переходов, чем ключевое слово с 50 000 запросов на позиции 15.
Да. Инструмент использует общедоступные поисковые данные: какие страницы ранжируются в Google, по каким ключевым словам и как часто люди ищут их. Он не получает доступ к аналитике сайта, журналам сервера или закрытым аккаунтам.
Поскольку цифры получены из открытых позиций, вы можете проверить любой сайт, который отображается в Google, включая конкурентов, партнёров и компании, которые планируете приобрести.
The report lists a site's closest competitors with their Domain Rating and estimated US visits. Check your own site first, then open each competitor. You see at once who gets more search traffic and whose link profile is stronger.
The main number is the site's estimated monthly visits from Google search, with the change over the last year. If a competitor shows 40,000 visits a month and growth of 20% in a year, their search strategy is working and worth studying.


Organic visits come from unpaid Google results. Paid visits come from Google Ads. The report splits the total into both. A site with 95% organic visits has earned its rankings. A site that lives on paid visits buys its position, and its organic pages are often easier to outrank.
The Top countries list shows each country's share of the site's Google visits. If a competitor gets 25% of its visits from the United States and 12% from India, you know which markets their content serves. The free check covers Google search only. It does not measure social, email or direct visits.
The trend chart shows monthly organic and paid search visits for the last 24 months. Compare drops and spikes with the dates on Google's list of ranking updates. A drop that starts on an update date often points to a content quality problem, not to seasonality.
The Top keywords table shows the site's best non-branded keywords with position, search volume, estimated traffic and difficulty. Start with keywords where the competitor ranks in the top 5 and the difficulty is below 50. On these keywords, a better page from you has a realistic chance to win.

Your report opens on this page in seconds. No sign-up. Here is an example for nytimes.com.
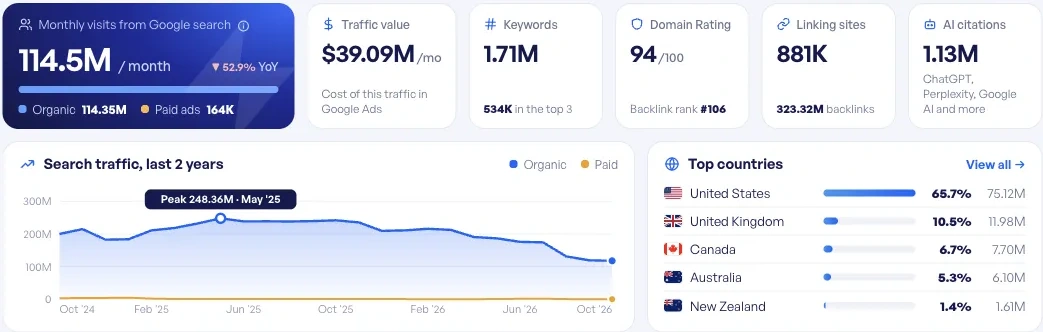
Estimates, not the website's own analytics.
A traffic estimate is only useful when it leads to a decision. These four steps turn one report into a short content plan.


Run the checker for your domain and for the three competitors you meet most often in Google. Note monthly visits, keywords in the top 3 and Domain Rating for each. Four rows in a spreadsheet show who leads and by how much.


Open each competitor's Top keywords table. Mark the keywords where they rank in the top 5 and you do not rank at all. These keywords already bring visits to someone in your market, so the demand is proven.


Compare the Top countries lists. If a competitor gets 15% of its visits from Germany and you get none, that market has demand you do not serve yet. A local-language page may be a better next step than a new topic.


Pick three to five keywords from step 2 and write one strong page for each. Answer the searcher's question faster and more fully than the page that ranks now. Google aims to rank the most helpful result, so one excellent page beats five thin ones.
The checker estimates traffic from Google search: organic and paid visits, keywords, countries, backlinks and AI citations. It does not measure visits from social media, email, referrals or direct type-ins, and it does not show bounce rate or time on site. For those numbers on your own site, use Google Analytics. Knowing the limits helps you use each number for the right decision.

This is the core of the report: estimated monthly organic visits, the keywords behind them and the positions they hold. For example, if a competitor's guide ranks 3rd for "best coffee machines" and brings about 1,200 visits a month, you know the topic has demand and which page you need to beat.
The report shows the top countries by share of Google visits. For example, if 10% of a competitor's visits come from Germany, you can plan German-language content or ads for that market. City-level data is not part of the free report.


Reviews of SparkTraffic services on Trustpilot and Shopper Approved.
If the report shows gaps you want to close, the SparkTraffic team can help. Tell us which keywords or markets you want to win, and we will suggest the next steps.


Enter the domain in the checker at the top of this page and select Check traffic. The report opens on the same page in seconds, without registration. It shows estimated monthly visits from Google search, top keywords, top countries, backlinks and competitors.
With SparkTraffic, enter a competitor’s URL into our Traffic Checker tool. You’ll get instant estimates of their visitor numbers, traffic sources, and top keywords, helping you identify opportunities to enhance your own traffic strategy.
It works for any domain that ranks in Google. Small sites with few ranking keywords may show low or zero estimates. That result is still useful: it tells you the site gets little search traffic today.
Use it to choose topics. Find keywords where competitors win, check the difficulty, and write one page that answers each searcher better than the current top result. Then check your site again in a few months to see if visits grow.
AI Overviews answer some questions on the results page, so fewer searchers click through. Our model lowers expected clicks for keywords that show an AI Overview. The AI citations number shows how often a site is mentioned in AI answers, which is a second way to measure visibility.
They are estimates, not analytics data, and they work best for comparing sites and spotting trends. Precision drops for small sites, sites with mostly brand searches, and sites that get most visits from social, email or apps. To test the model, check your own site and compare the result with your clicks in Google Search Console.
No. The full free report opens on this page without an account, an email or a card.
Each report shows its update date at the top, for example "Updated 27 Oct 2026". The 2-year chart shows monthly values, so you can see recent changes next to the long-term trend.
The checker only needs a domain name. It does not ask for your name, email or payment details, and it does not connect to any analytics account. SparkTraffic is a company registered in Spain and follows the GDPR.
Yes. The report lists the top countries by share of Google visits, for example 25% from the United States and 12% from India.
Google Analytics measures real visits to a site you own. The SparkTraffic checker estimates Google search visits for any site, including competitors. Use Analytics for your own numbers and the checker to compare yourself with others.


